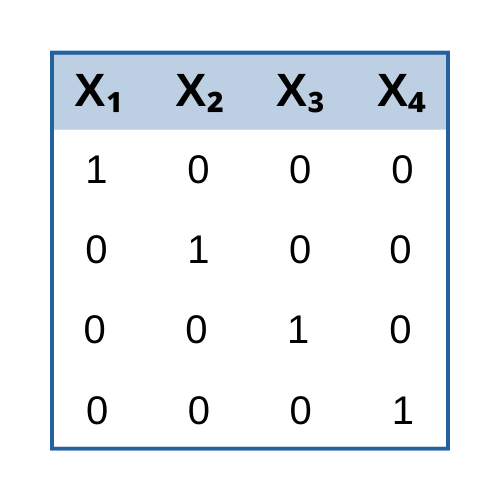
new blog post: Member Training: Dummy and Effect Coding
Previous Posts
In Part 10, let’s look at the aggregate command for creating summary tables using R. You may have a complex data set that includes categorical variables of several levels, and you may wish to create summary tables for each level of the categorical variable. For example, your data set may include the variable Gender, a two-level categorical variable with levels Male and Female. Your data set may include other categorical variables such as Ethnicity, Hair Colour, the Treatments received by patients in a medical study, or the number of cylinders in motor vehicles.
In this series, we’ve already talked about what a complex sample isn’t; why you’d ever bother with a complex sample; and stratified sampling. All this is in support of our upcoming workshop: Introduction to the Analysis of Complex Survey Data Using SPSS. If you want to learn a lot more on this topic, check that […]
In stratified sampling, the target population is first classified into subgroups or strata. (Grammar note: “strata” is plural for “stratum” just as “data” is plural for “datum.”). A simple random sample is then selected within every stratum.
In our last article, we talked about simple random samples. Simple random samples are, well…simple, but they’re not always optimal or even possible. Probability samples that don’t meet the assumptions of Simple Random Samples are called Complex Samples.
Simple Random Samples (SRS) have a few important features. 1. Each element in the population has an equal probability of being selected to the sample. That’s pretty self-explanatory, but it has important consequences and requirements.
In this follow-up to December’s webinar, we’ll finish up our discussion of interactions. There is something about interactions that is incredibly confusing. An interaction between two predictor variables means that one predictor variable affects a third variable differently at different values of the other predictor.
Of course, the main effect for condition in this full model with the interaction will test the same thing, as well as give you additional information at different ages. So your second option is:
by Lucy Fike We know that using SPSS syntax is an easy way to organize analyses so that you can rerun them in the future without having to go through the menu commands. Using Python with SPSS makes it much easier to do complicated programming, or even basic programming, that would be difficult to do […]
In Part 9, let’s look at sub-setting in R. I want to show you two approaches. Let’s provide summary tables on the following data set of tourists from different nations, their gender and numbers of children. Copy and paste the following array into R.
There is something about interactions that is incredibly confusing. An interaction between two predictor variables means that one predictor variable affects a third variable differently at different values of the other predictor.
 stat skill-building compass