new blog post: Member Training: Dummy and Effect Coding
Previous Posts
In Part 8, let’s look at some basic commands in R. Set up the following vector by cutting and pasting from this document: a <- c(3,-7,-3,-9,3,-1,2,-12, -14) b <- c(3,7,-5, 1, 5,-6,-9,16, -8) d <- c(1,2,3,4,5,6,7,8,9) Now figure out what each of the following commands do. You should not need me to explain each command, but I will explain a few.
In Part 7, let’s look at further plotting in R. Try entering the following three commands together (the semi-colon allows you to place several commands on the same line). Let’s take an example with two variables and enhance it.
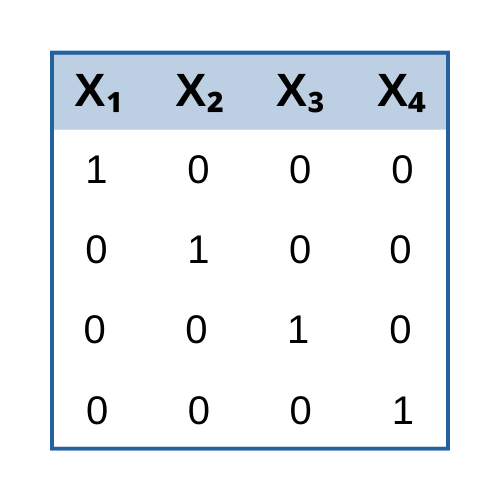
In our previous posts, we discussed factors and factor loadings and rotations. In this post, I would like to address another important detail for a successful factor analysis, the type of variables that you include in your analysis.
Complex Surveys use a sampling technique other than a simple random sample. Terms you may have heard in this area include cluster sampling, stratified sampling, oversampling, two-stage sampling, and primary sampling unit. Complex Samples require statistical methods that take the exact sampling design into account to ensure accurate results.
I sometimes get asked questions that many people need the answer to. Here's one about non-parametric anova. Question: Is there a non-parametric 3 way ANOVA out there and does SPSS have a way of doing a non-parametric anova sort of thing with one main independent variable and 2 highly influential cofactors?
In Part 6, let’s look at basic plotting in R. Try entering the following three commands together (the semi-colon allows you to place several commands on the same line). x <- seq(-4, 4, 0.2) ; y <- 2*x^2 + 4*x - 7 plot(x, y)
When you use the menus in SPSS, you're really taking a shortcut. You're telling SPSS which syntax commands, along with which options, you want to run. Clicking OK at the end of a dialog box will run the menu options you just picked. You may never see the underlying commands that SPSS just ran. If instead you hit Paste, those command won't automatically be run, but will instead the code to run those commands will be copied into the Syntax window.
You will notice that, for example, both procedures have a FIXED and a RANDOM subcommand. The FIXED subcommand lists the fixed effects. The only really differences are that in GENLINMIXED you have to put EFFECTS= and you have to specify that you do want an intercept.
The ratio of the between-cluster variance to the total variance is the Intraclass Correlation. It tells you the proportion of the total variance in Y that the clustering accounts for. You can also interpret it as the correlation among observations within the same cluster.
Item Response Theory (IRT) refers to a family of statistical models for evaluating the design and scoring of psychometric tests, assessments and surveys. It is used on assessments in psychology, psychometrics, education, health studies, marketing, economics and social sciences — assessments that involve categorical items (e.g., Likert items).
 stat skill-building compass