The Intraclass Correlation Coefficient, or ICC, can be very useful in many statistical situations, but especially so in Linear Mixed Models.
Linear Mixed Models are used when there is some sort of clustering in the data.
Two common examples of clustered data include:
- individuals sampled within sites (hospitals, companies, community centers, schools, etc.). The site is the cluster.
- repeated measures or longitudinal data where you collect multiple observations from the same individual. The individual is the cluster in which multiple observations are grouped.
Observations from the same cluster are usually more similar to each other than observations from different clusters. If they are, you can’t use statistical methods that assume independence. If you do, estimates of variance, and therefore p-values, will be incorrect.
Mixed models not only account for the correlations among observations in the same cluster, they give you an estimate of that correlation.
What is the Intraclass Correlation Coefficient?

Here you can see the equation of a very simple linear mixed model. It has a single fixed independent variable, X, and a single random effect u. For simplicity, I’m going to assume that I’ve already centered X on its mean. This is also known as a random intercept model.
The subscripts i and j on the Y indicate that each observation j is nested within cluster i.
The u represents the random intercept for each cluster. It works the same way as a residual term, and measures the distance from each subject’s intercept to the overall intercept β0. Rather than calculate an estimate for every one of those distances, the model estimates a single variance σ20.
That variance parameter estimate is the between-cluster variance. The variance of the residuals is the within-cluster variance. Their sum is the total variance in Y that is not explained by X.
 If there is no real correlation among observations within a cluster, the cluster means won’t differ.
It’s only when some clusters have generally high values and others have relatively low values that the values within a cluster are correlated.
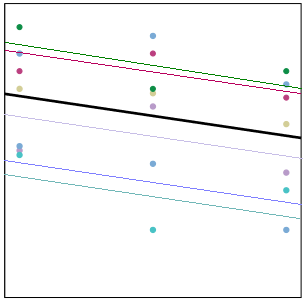
In the graph on the right, each cluster has its own trajectory of a different color. The thick black line represents the overall trajectory, averaged across all clusters.
Some clusters, like the magenta one, have all three values above the overall (black) mean. Those values will be correlated, because they’re all relatively high. Simultaneously, those three points have a high mean.
Likewise, the turquoise cluster has all three values below the overall (black) mean. Again, those values will be correlated, because they’re all relatively low. And the turquoise mean is quite low.
And so it goes. When some clusters have generally high values and others have generally low, (in other words, where there is consistency among a cluster’s responses), there is variation among the clusters’ means. This is the between-cluster variance.
The within-cluster variance represents how far each point is to the cluster specific mean. In other words, what is the variation of the magenta points around the magenta trajectory? Are they close (small variance) or far (high variance)?
In this graph, it’s pretty small. Because those magenta points are all pretty high, they are quite close to their trajectory, and there is not a lot of within-cluster variation.

The ratio of the between-cluster variance to the total variance is the Intraclass Correlation. It tells you the proportion of the total variance in Y that the clustering accounts for.
You can also interpret it as the correlation among observations within the same cluster.
Why ICC is useful
1. It can help you determine whether or not a linear mixed model is even necessary. If you find that the correlation is zero, that means the observations within clusters are no more similar than observations from different clusters. Go ahead and use a simpler analysis technique.
2. It can be theoretically meaningful to understand how much of the overall variation in the response is explained simply by clustering. For example, in a repeated measures psychological study you can tell to what extent mood is a trait (varies among people, but not within a person on different occasions) or state (varies little on average among people, but varies a lot across occasions).
3. It can also be meaningful to see how the ICC (as well as the between and within cluster variances) changes as you add variables to the model.

If i have to use generalized mixed model is it valid to use the calculation of the ICC of the linear mixed model or do I have to recalculate it because it is different for linear vs. generalized mixed models?
You’d want to recalculate it.
Thank you for this very useful and clear presentation. I need to use intraclass correlation to measure the absolute agreement between two examiners. However, your formula “only” measures the consistency of agreement between the examiners. Do you know how to deduce the absolute agreement from a mixed model? In advance, thank you very much for your reply!
Hi J-B,
That is actually a different use of ICC than what I’m describing here.
Thank you for helpful notes. I am confused about when to use or not use multilevel alalysis using ICC as indicator. What is the cuttpoint to run multi level analysis by see the output of ICC?
Thank you very much for this very helpful explanation.
I have one question. I’ve seen that we can calculate the ICC using this formula:
ICC = residual / (residual+intercept)
and I have also seen this:
ICC = variance of IV / (variance of IV) + (variance of error)
I’m using SPSS and I fitted a model via: Analyse –> Mixed Models –> Generalized Linear. However, in the output, I’m not sure what Table I’m supposed to look at to get the values for residual, intercept or variance, variance of error, that will help me calculate the ICC.Thank you.
Such a great explanation! Generally, what would it mean if the ICC was higher/lower when more variables added to a model?
Hi Karen,
Thanks for the post. Could you check the following expression in your post correct or not?
Cov(Y_ij , Y_ij’ ) = u_i =sigma_0^2
I think the u_i should be replaced by Var(u_i). Thanks.
Thank you for the information.
I am still in search of how to calculate it in SPSS. Which tool is available and what is the process to calculate intra-class correlation.
Hi, i believe ICC cannot be calculated in SPSS. The equation is easy enough to use:
residual / (residual+intercept) = ICC
Thanks for this lucid explication. I’m seeking guidance about threshold values of ICC for switching from OLS to HLM when cases (in this case students) are clustered (in this case schools or colleges). As you note the choice is simple and obvious when ICC=0. But it’s rarely zero. I seem to recall seeing folks use .1 as a rule of thumb (ie ICC>.1 suggests the need to compensate for nesting). Does that sound right? Might you recommend a source for this? Many thanks…
While blanket cutoff points are always a potential problem this article covers how ICC at different levels affects AIC and other measures of model fit. 0.1 in their work is where they saw models that accounted for it and ones that didn’t pull away from each other. http://www.cibtech.org/sp.ed/jls/2015/02/185-JLS-S2-188-KIANOUSH-APPLICATION%20%20-78.pdf
Great explanation. Thank
please,
for my master thesis, I work on linear mixed effect model. i meet som problem please can you help me?
1. I would like to know really what I will deals in my output
2. how to interprate the ML or REML?
3. how to interprate ICC?
4. how to interprate random intercept and random slope?
Wonderful explanation! So intuitive, my students really liked it.
I have the following question – suppose you have a continuous signal with minute to minute observations per subject (e.g. continuous glucose monitoring). Will mixed models be useful to compare, say, between two treatments?
Sincerely
Victor
I suppose what you are explaining is similar to what is called daily diary design. I think HLM would be appropriate for such design
Is there a recommended resource for how to compute ICCs in SPSS or State specifically for determining whether to use a multilevel model? Everything I am finding is on how to compute an ICC for repeated measures designs. Thanks!
Hi Karen,
Thanks for this accessible post. One comment: you say “If you find that the correlation is zero, that means the observations within clusters are no more similar than observations from different clusters.” But it could be that you haven’t enough power, right?
Thanks
Sort of. You could have an ICC estimate that is “statistically significant” but is so close to zero that it’s essentially null. Better to focus on the effect size estimate and go from there. Power is less about the effect size and more about uncertainty regarding it (i.e., SEs).
Thanks for the note, i m iostatistics in shiraz university(Iran) it was helpful for me.
Karen, thank you for writing the article, The Intraclass Correlation Coefficient in Mixed Models. I’m enrolled in your upcoming “Analyzing Repeated Measures Data Workshop,” and I fit the criterion of “not for you” because of my lack of knowledge of the basic principles in the workshop. I have about 3 weeks to learn as many of those basic principles as possible, before my own lectures start, because I must be able to analyze my PhD research data within a longitudinal repeated-measures design, whether I know the concepts or not. After reading your article, I was able to understand the introduction of West et al’s book on Linear Mixed Models, and I feel that there is some hope! I couldn’t understand, before. Your article was not only well-written and easy to understand, but explained the principles in a way that I can remember. Thank you!
Hi Eleanor,
Thanks for the kind note. I’m glad that you found this so helpful. We are definitely going to cover a LOT in that workshop, and much of it requires the noted background.
West et. al is excellent, and that’s great you have it. If you haven’t seen this article, please use it as a starting point to get caught up: https://www.theanalysisfactor.com/concepts-you-need-to-understand-to-run-a-mixed-or-multilevel-model/
Also, the bonus videos that are available on the Repeated Measures workshop site should give you a bit of background, so be sure to watch those before we begin.