new blog post: Member Training: Dummy and Effect Coding
Previous Posts
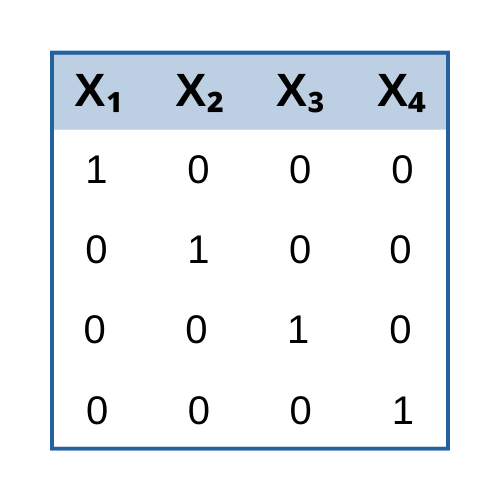
Here’s a little tip. When you construct Dummy Variables, make it easy on yourself to remember which code is which. Heck, if you want to be really nice, make it easy for anyone else who will analyze the data or read the results. Make the codes inherent in the Dummy variable name. So instead of […]
So this is the actual model for an ordinary least squares linear regression. The left hand side of the equation is just Y and ε, the error term, has a normal distribution. For other types of regression models, like logistic regression, Poisson regression, or multilevel models, all the βs and Xs stay the same. The only parts that can differ: 1. Instead of Y on the left, there can be a function of Y--a non-linear transformation. 2. Instead of a normal distribution, the residuals can have another distribution.
This one is relatively simple. Very similar names for two totally different concepts. Hierarchical Models (aka Hierarchical Linear Models or HLM) are a type of linear regression models in which the observations fall into hierarchical, or completely nested levels. Hierarchical Models are a type of Multilevel Models. So what is a hierarchical data structure, which […]
It was only after repeated probing that I realized she was logically trying to fit it into the concepts of alpha and beta that we had already taught her--Type I and Type II errors in hypothesis testing. Entirely. Different. Concepts.
One of the biggest challenges in learning statistics and data analysis is learning the lingo. It doesn't help that half of the notation is in Greek (literally). The terminology in statistics is particularly difficult to learn because often the same word or symbol is used to mean completely different concepts.
If you’ve ever tried sharing SPSS output with your collaborators, advisor, or statistical consultant, you have surely noticed that the output is often not compatible across different versions of SPSS. And if you work in a company where everyone is working on the same site license, it’s not a problem. But if you’re collaborating with […]
Many years ago, when I was teaching in a statistics department, I had my first consulting gig. Two psychology researchers didn’t know how to analyze their paired rank data. Unfortunately, I didn’t either. I asked a number of statistics colleagues (who didn’t know either), then finally borrowed a nonparametrics book. The answer was right there. […]
Why is using regression, or logistic regression "better" than doing bivariate analysis such as Chi-square? I read a lot of studies in my graduate school studies, and it seems like half of the studies use Chi-Square to test for association between variables, and the other half, who just seem to be trying to be fancy, conduct some complicated regression-adjusted for-controlled by- model. But the end results seem to be the same.
Number 4: This morning, I received an email listing some interesting facts, among them: "Banging your head against a wall burns 150 calories an hour." I'm pretty sure that one is not specifically about SPSS, but it could be.
I find the three variable definitions that I use the most are defining Variable Labels, Value Labels and Missing Data codes. The syntax is simple and logical for all three, so I'm going to just give you the basic code, which you can keep on hand and edit as you need.
 stat skill-building compass