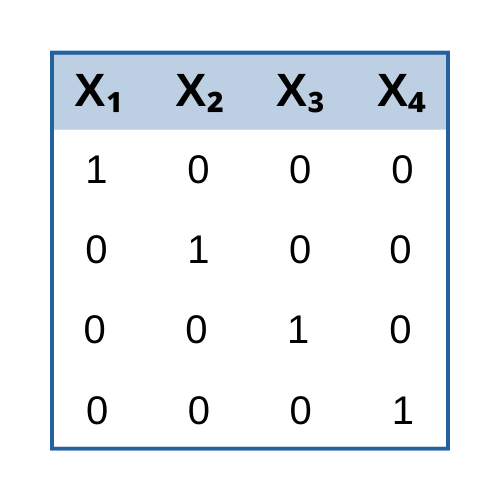
new blog post: Member Training: Dummy and Effect Coding
Previous Posts
I find SPSS manuals, as a rule, marginally useful. Sure they may tell you which options are available when doing Statistic X, but not what they mean or when to use them. I still use them, of course, but only when I have no other options. There is one exception, though, and that is the Command Syntax Reference. This is the manual that explains all the SPSS Syntax commands.
So hopefully I've extolled the benefits of using SPSS Syntax enough that you're convinced it is something you should regularly use. Even if you don't start programming, there are two things you can do to begin learning Syntax and give you the communication and tracking benefits. 1. From now on, when you use menus for an analysis, instead of clicking the "OK" button, click "Paste."*
Like any applied skill, mastering statistical analysis requires: 1. building a body of knowledge 2. adeptness of the tools of the trade (aka software package) 3. practice applying the knowledge and using the tools in a realistic, meaningful context.
You don't do all your data analysis in SPSS menus, right? (Please, please tell me you don't). There's really nothing wrong with using the menus. It's a great way to get started using SPSS and it saves you the hassle of remembering all that code. But there are some really, really good reasons to use the syntax as well.
The next webinar in the Craft of Statistical Analysis series is: The First Three Steps to Performing Any Statistical Model: Define and Design All statistical modeling–whether ANOVA, Multiple Regression, Poisson Regression, Multilevel Model–is about understanding the relationship between independent and dependent variables. The first 3 steps in modeling set up the entire rest of the […]
As a data analyst, you will occasionally need to know how your software package is calculating the statistics. SPSS makes the algorithms for many of its tests available at:
Sometimes it's because the dependent variable just isn't appropriate for a GLM. The dependent variable, Y, doesn't have to be normal for the residuals to be normal (since Y is affected by the X's). But Y does have to be continuous, unbounded, and measured on an interval or ratio scale.
I know you know it--those assumptions in your regression or ANOVA model really are important. If they're not met adequately, all your p-values are inaccurate, wrong, useless. But, and this is a big one, the GLM is robust to departures from those assumptions. Meaning, they don't have to fit exactly to be accurate, right, useful.
If you are a SPSS, SAS, or Stata user who finds yourself needing to use R (I mean, it’s free), I just found this great website: http://statmethods.net/index.html.
The authors had run the same logistic regression model separately for each sex because they expected that the effects of the predictors were different for men and women. On the surface, there is nothing wrong with this approach. It's completely legitimate to consider men and women as two separate populations and to model each one separately. As often happens, the problem was not in the statistics, but what they were trying to conclude from them. The authors went on to compare the two models, and specifically compare the coefficients for the same predictors across the two models.
 stat skill-building compass