• Skip to primary navigation
  • Skip to main content
  • Skip to primary sidebar
The Analysis Factor

The Analysis Factor

Statistical Consulting, Resources, and Statistics Workshops for Researchers

  • our programs
    • Membership
    • Online Workshops
    • Free Webinars
    • Consulting Services
  • statistical resources
  • blog
  • about
    • Our Team
    • Our Core Values
    • Our Privacy Policy
    • Employment
    • Collaborate with Us
  • contact
  • login

Mixed and Multilevel Models

Member Training: Multinomial Logistic Regression

by TAF Support  Leave a Comment

Multinomial logistic regression is an important type of categorical data analysis. Specifically, it’s used when your response variable is nominal: more than two categories and not ordered.
[Read more…] about Member Training: Multinomial Logistic Regression

Tagged With: categorical variable, logistic regression, Multinomial Logistic Regression

Related Posts

  • Member Training: Using Excel to Graph Predicted Values from Regression Models
  • Member Training: Hierarchical Regressions
  • Member Training: Goodness of Fit Statistics
  • Member Training: Explaining Logistic Regression Results to Non-Researchers

Member Training: Translating Between Multilevel and Mixed Models

by TAF Support  1 Comment

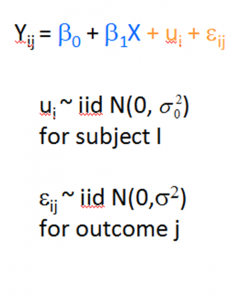
Multilevel and Mixed models are essentially the same analysis. But they use different vocabulary, different notation, and approach the analysis considerations in different ways.
[Read more…] about Member Training: Translating Between Multilevel and Mixed Models

Tagged With: mixed models, multilevel models

Related Posts

  • Member Training: Matrix Algebra for Data Analysts: A Primer
  • Member Training: A Gentle Introduction To Random Slopes In Multilevel Models
  • Member Training: A Gentle Introduction to Multilevel Models
  • Member Training: Latent Growth Curve Models

An Example of Specifying Within-Subjects Factors in Repeated Measures

by Karen Grace-Martin  Leave a Comment

Some repeated measures designs make it quite challenging to  specify within-subjects factors. Especially difficult is when the design contains two “levels” of repeat, but your interest is in testing just one.

Let’s look at a great example of what this looks like and how to deal with it in this question from a reader :

The Design:

I want to do a GLM (repeated measures ANOVA) with the valence of some actions of my test-subjects (valence = desirability of actions) as a within-subject factor. My subjects have to rate a number of actions/behaviours in a pre-set list of 20 actions from ‘very likely to do’ to ‘will never do this’ on a scale from 1 to 7, and some of these actions are desirable (e.g. help a blind man crossing the street) and therefore have a positive valence (in psychology) and some others are non-desirable (e.g. play loud music at night) and therefore have negative valence in psychology.

My question is how I can use valence as a within-subjects factor in GLM. Is there a way to tell SPSS some actions have positive valence and others have negative valence ? I assume assigning labels to the actions will not do it, as SPSS does not make analyses based on labels …
Please help. Thank you.

[Read more…] about An Example of Specifying Within-Subjects Factors in Repeated Measures

Tagged With: linear mixed model, repeated measures anova, within subject factor

Related Posts

  • When Does Repeated Measures ANOVA not work for Repeated Measures Data?
  • Six Differences Between Repeated Measures ANOVA and Linear Mixed Models
  • Specifying Fixed and Random Factors in Mixed Models
  • The Difference Between Random Factors and Random Effects

Measures of Model Fit for Linear Regression Models

by Karen Grace-Martin  38 Comments

A well-fitting regression model results in predicted values close to the observed data values. Stage 2

The mean model, which uses the mean for every predicted value, generally would be used if there were no useful predictor variables. The fit of a proposed
regression model should therefore be better than the fit of the mean model. [Read more…] about Measures of Model Fit for Linear Regression Models

Tagged With: F test, Model Fit, R-squared, regression models, RMSE

Related Posts

  • The Difference Between R-squared and Adjusted R-squared
  • Simplifying a Categorical Predictor in Regression Models
  • Why ANOVA is Really a Linear Regression, Despite the Difference in Notation
  • Can a Regression Model with a Small R-squared Be Useful?

Specifying Fixed and Random Factors in Mixed Models

by Karen Grace-Martin  12 Comments

One of the difficult decisions in mixed modeling is deciding which factors are fixed and which are random. And as difficult as it is, it’s also very important. Correctly specifying the fixed and random factors of the model is vital to obtain accurate analyses.

Now, you may be thinking of the fixed and random effects in the model, rather than the factors themselves, as fixed or random. If so, remember that each term in the model (factor, covariate, interaction or other multiplicative term) has an effect. We’ll come back to how the model measures the effects for fixed and random factors.

Sadly, the definitions in many texts don’t help much with decisions to specify factors as fixed or random. Textbook examples are often artificial and hard to apply to the real, messy data you’re working with.

Here’s the real kicker. The same factor can often be fixed or random, depending on the researcher’s objective.

That’s right, there isn’t always a right or a wrong decision here. It depends on the inferences you want to make about this factor. This article outlines a different way to think about fixed and random factors.

An Example

Consider an experiment that examines beetle damage on cucumbers. The researcher replicates the experiment at five farms and on four fields at each farm.

There are two varieties of cucumbers, and the researcher measures beetle damage on each of 50 plants at the end of the season. The researcher wants to measure differences in how much damage the two varieties sustain.

The experiment then has the following factors: VARIETY, FARM, and FIELD.

Fixed factors can be thought of in terms of differences.

The effect of a categorical fixed factor is measured by differences from the overall mean.

The effect of a continuous fixed predictor (usually called a covariate) is defined by its slope–how the mean of the dependent variable differs with differing values of the predictor.

The output for fixed predictors, then, gives estimates for mean-differences or slopes.

Conclusions regarding fixed factors are particular to the values of these factors. For example, if one variety of cucumber has significantly less damage than the other, you can make conclusions about these two varieties. This says nothing about cucumber varieties that were not tested.

Random factors, on the other hand, are defined by a distribution and not by differences.

The values of a random factor are assumed to be chosen from a population with a normal distribution with a certain variance.

The output for a random factor is an estimate of this variance and not a set of differences from a mean. Effects of random factors are measured in terms of variance, not mean differences.

For example, we may find that the variance among fields makes up a certain percentage of the overall variance in beetle damage. But we’re not measuring how much higher the beetle damage is in one field compared to another. We only care that they vary, not how much they differ.

Software specification of fixed and random factors

Before we get into specifying factors as fixed and random, please note:

When you’re specifying random effects in software, like intercepts and slopes, the random factor is itself the Subject variable in your software. This differs in different software procedures. Some specifically ask for code like “Subject=FARM.” Others just put FARM after a || or some other indicator of the subject for which random intercepts and slopes are measured.

Some software, like SAS and SPSS, allow you to specify the random factors two ways. One is to list the random effects (like intercept) along with the random factor listed as a subject.

/Random Intercept | Subject(Farm)

The other is to list the random factors themselves.

/Random Farm

Both of those give you the same output.

Other software, like R and Stata, only allow the former. And neither uses the term “Subject” anywhere. But that random factor, the subject, still needs to be specified after the | or || in the random part of the model.

Specifying fixed effects is pretty straightforward.

Situations that indicate a factor should be specified as fixed:

1. The factor is the primary treatment that you want to compare.

In our example, VARIETY is definitely fixed as the researcher wants to compare the mean beetle damage on the two varieties.

2. The factor is a secondary control variable, and you want to control for differences in the specific values of this factor.

Say the researcher chose these farms specifically for some feature they had, such as specific soil types or topographies that may affect beetle damage. If the researcher wants to compare the farms as representatives of those soil types, then FARM should be fixed.

3. The factor has only two values.

Even if everything else indicates that a factor should be random, if it has only two values, the variance cannot be calculated, and it should be fixed.

Situations that indicate random factors:

1. Your interest is in quantifying how much of the overall variance to attribute to this factor.

If you want to know how much of the variation in beetle damage you can attribute to the farm at which the damage took place, FARM would be random.

2. Your interest is not in knowing which specific means differ, but you want to account for the variation in this factor.

If the farms were chosen at random, FARM should be random.

This choice of the specific farms involved in the study is key. If you can rerun the study using different specific farms–different values of the Farm factor–and still be able to draw the same conclusions, then Farm should be random. However, if you want to compare or control for these particular farms, then Farm is a fixed factor.

3. You would like to generalize the conclusions about this factor to the whole population.

There is nothing about comparing these specific fields that is of interest to the researcher. Rather, the researcher wants to generalize the results of this experiment to all fields, so FIELD is random.

4. Any interaction with a random factor is also random.

How the factors of a model are specified can have great influence on the results of the analysis and on the conclusions drawn.


Tagged With: Fixed Factor, mixed model, multilevel model, Proc Mixed, Random Factor, S-Plus, SAS, SPSS, Stata

Related Posts

  • Multilevel, Hierarchical, and Mixed Models–Questions about Terminology
  • The Difference Between Random Factors and Random Effects
  • Confusing Statistical Terms #3: Level
  • The Difference Between Crossed and Nested Factors

Member Training: Matrix Algebra for Data Analysts: A Primer

by Karen Grace-Martin  4 Comments

If you’ve been doing data analysis for very long, you’ve certainly come across terms, concepts, and processes of matrix algebra.  Not just matrices, but:

  • Matrix addition and multiplication
  • Traces and determinants
  • Eigenvalues and Eigenvectors
  • Inverting and transposing
  • Positive and negative definite

[Read more…] about Member Training: Matrix Algebra for Data Analysts: A Primer

Tagged With: Factor Analysis, linear, matrix, mixed model, multivariate analysis

Related Posts

  • Member Training: Goodness of Fit Statistics
  • Member Training: Generalized Linear Models
  • Member Training: Power Analysis and Sample Size Determination Using Simulation
  • Member Training: Confirmatory Factor Analysis

  • Go to page 1
  • Go to page 2
  • Go to page 3
  • Interim pages omitted …
  • Go to page 13
  • Go to Next Page »

Primary Sidebar

This Month’s Statistically Speaking Live Training

  • Member Training: The Link Between ANOVA and Regression

Upcoming Workshops

    No Events

Upcoming Free Webinars

TBA

Quick links

Our Programs Statistical Resources Blog/News About Contact Log in

Contact

Upcoming

Free Webinars Membership Trainings Workshops

Privacy Policy

Search

Copyright © 2008–2023 The Analysis Factor, LLC.
All rights reserved.

The Analysis Factor uses cookies to ensure that we give you the best experience of our website. If you continue we assume that you consent to receive cookies on all websites from The Analysis Factor.
Continue Privacy Policy
Privacy & Cookies Policy

Privacy Overview

This website uses cookies to improve your experience while you navigate through the website. Out of these, the cookies that are categorized as necessary are stored on your browser as they are essential for the working of basic functionalities of the website. We also use third-party cookies that help us analyze and understand how you use this website. These cookies will be stored in your browser only with your consent. You also have the option to opt-out of these cookies. But opting out of some of these cookies may affect your browsing experience.
Necessary
Always Enabled
Necessary cookies are absolutely essential for the website to function properly. This category only includes cookies that ensures basic functionalities and security features of the website. These cookies do not store any personal information.
Non-necessary
Any cookies that may not be particularly necessary for the website to function and is used specifically to collect user personal data via analytics, ads, other embedded contents are termed as non-necessary cookies. It is mandatory to procure user consent prior to running these cookies on your website.
SAVE & ACCEPT