I recently opened a very large data set titled “1998 California Work and Health Survey” compiled by the Institute for Health Policy Studies at the University of California, San Francisco. There are 1,771 observations and 345 variables. (more…)
OptinMon
Stata Loops and Macros for Large Data Sets: Quickly Finding Needles in the Hay Stack
August 7th, 2015 by Jeff Meyer
Using the Collapse Command in Stata
July 24th, 2015 by Jeff Meyer
Have you ever worked with a data set that had so many observations and/or variables that you couldn’t see the forest for the trees? You would like to extract some simple information but you can’t quite figure out how to do it.
Get to know Stata’s collapse command–it’s your new friend. Collapse allows you to convert your current data set to a much smaller data set of means, medians, maximums, minimums, count or percentiles (your choice of which percentile).
Let’s take a look at an example. I’m currently looking at a longitudinal data set filled with economic data on all 67 counties in Alabama. The time frame is in decades, from 1960 to 2000. Five time periods by 67 counties give me a total of 335 observations.
What if I wanted to see some trend information, such as the total population and jobs per decade for all of Alabama? I just want a simple table to see my results as well as a graph. I want results that I can copy and paste into a Word document.
Here’s my code:
preserve

collapse (sum) Pop Jobs, by(year)

graph twoway (line Pop year) (line Jobs year), ylabel(, angle(horizontal))

list
And here is my output:
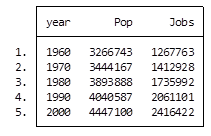
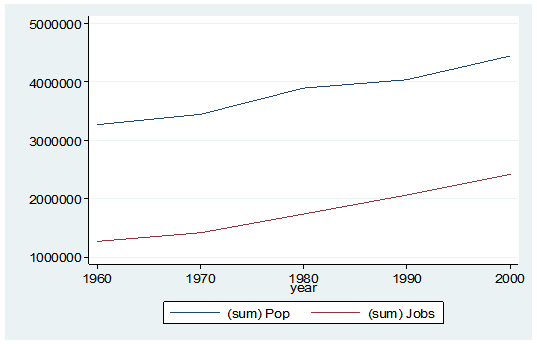
By starting my code with the preserve command it brings my data set back to its original state after providing me with the results I want.
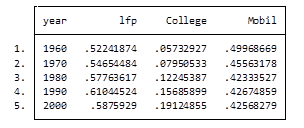
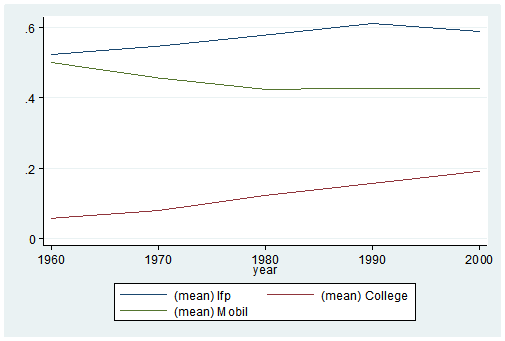
What if I want to look at variables that are in percentages, such as percent of college graduates, mobility and labor force participation rate (lfp)? In this case I don’t want to sum the values because they are in percent.
Calculating the mean would give equal weighting to all counties regardless of size.
Fortunately Stata gives you a very simple way to weight your data based on frequency. You have to determine which variable to use. In this situation I will use the population variable.
Here’s my coding and results:
Preserve

collapse (mean) lfp College Mobil [fw=Pop], by(year)

graph twoway (line lfp year) (line College year) (line Mobil year), ylabel(, angle(horizontal))

list
It’s as easy as that. This is one of the five tips and tricks I’ll be discussing during the free Stata webinar on Wednesday, July 29th.
Jeff Meyer is a statistical consultant with The Analysis Factor, a stats mentor for Statistically Speaking membership, and a workshop instructor. Read more about Jeff here.
Using Stored Calculations in Stata to Center Predictors: an Example
July 9th, 2015 by Jeff Meyer
One of Stata’s incredibly useful abilities is to temporarily store calculations from commands.
Why is this so useful? (more…)
Measures of Predictive Models: Sensitivity and Specificity
June 5th, 2015 by Karen Grace-Martin
A few years ago, I was in Syracuse for a family trip to the zoo. Syracuse is about 50 miles from where I live and it has a very nice little zoo.
One year was particularly exciting because a Trader Joe’s just opened in Syracuse. We don’t have one where we live* (sadly!) so we always stock up on our favorite specialty groceries when we’re near a Trader Joe’s.
On this particular trip, though, we had an unwelcome surprise. My credit card card company believed my Trader Joe’s spree was fraudulent and declined the transaction. I got a notice on my phone and was able to fix it right away, so it wasn’t the big inconvenience it could have been.
But this led us to wonder what it was about the transaction that led the bank to believe it was fraudulent. Do credit card thieves often skip town and go grocery shopping?
The bank was clearly betting so. It must have a statistical model for aspects of a transaction that are likely enough to be fraudulent that it shuts it down. (more…)
Effect Size Statistics in Logistic Regression
May 18th, 2015 by Karen Grace-Martin
Effect size statistics are expected by many journal editors these days.
If you’re running an ANOVA, t-test, or linear regression model, it’s pretty straightforward which ones to report.
Things get trickier, though, once you venture into other types of models.
What is a Logit Function and Why Use Logistic Regression?
May 11th, 2015 by Karen Grace-Martin
One of the big assumptions of linear models is that the residuals are normally distributed. This doesn’t mean that Y, the response variable, has to also be normally distributed, but it does have to be continuous, unbounded and measured on an interval or ratio scale.
Unfortunately, categorical response variables are none of these.