
One data manipulation task that you need to do in pretty much any data analysis is recode data. It’s almost never the case that the data are set up exactly the way you need them for your analysis.
In R, you can re-code an entire vector or array at once. To illustrate, let’s set up a vector that has missing values.
A <- c(3, 2, NA, 5, 3, 7, NA, NA, 5, 2, 6)
A
[1] 3 2 NA 5 3 7 NA NA 5 2 6
We can re-code all missing values by another number (such as zero) as follows: (more…)
SPSS has the Count Values within Cases option, but R does not have an equivalent function. Here are two functions that you might find helpful, each of which counts values within cases inside a rectangular array. (more…)
A central concept in statistics is the level of measurement of a variable. It’s so important to everything you do with data that it’s usually taught within the first week in every intro stats class.
But even something so fundamental can be tricky once you start working with real data. (more…)
In Part 13, let’s see how to create box plots in R. Let’s create a simple box plot using the boxplot() command, which is easy to use. First, we set up a vector of numbers and then we plot them.
Box plots can be created for individual variables or for variables by group (more…)
I’m sure you’ve heard that R creates beautiful graphics.
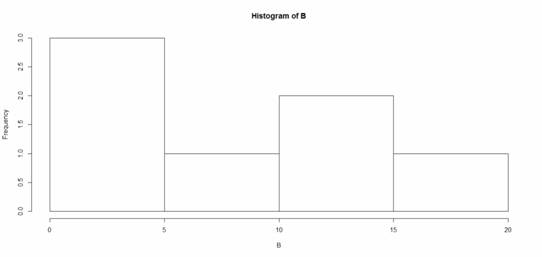
It’s true, and it doesn’t have to be hard to do so. Let’s start with a simple histogram using the hist() command, which is easy to use, but actually quite sophisticated.
First, we set up a vector of numbers and then we create a histogram.
B <- c(2, 4, 5, 7, 12, 14, 16)
hist(B)
That was easy, but you need more from your histogram. (more…)
Let’s create a simple bar chart in R using the barplot() command, which is easy to use.
First, we set up a vector of numbers. Then we count them using the table() command, and then we plot them.
The table() command creates a simple table of counts of the elements in a data set.
H <- c(2,3,3,3,4,5,5,5,5,6)
Now we count the elements using the table() command, as follows: (more…)