 One of our instructors–David Lillis–recently gave a talk in front of the Wellington R Users Group highlighting 15 Tips for using the R statistical programming language aimed at the beginner.
Below is a video recording of his presentation…
One of our instructors–David Lillis–recently gave a talk in front of the Wellington R Users Group highlighting 15 Tips for using the R statistical programming language aimed at the beginner.
Below is a video recording of his presentation…
In Part 13, let’s see how to create box plots in R. Let’s create a simple box plot using the boxplot() command, which is easy to use. First, we set up a vector of numbers and then we plot them.
Box plots can be created for individual variables or for variables by group (more…)
I’m sure you’ve heard that R creates beautiful graphics.
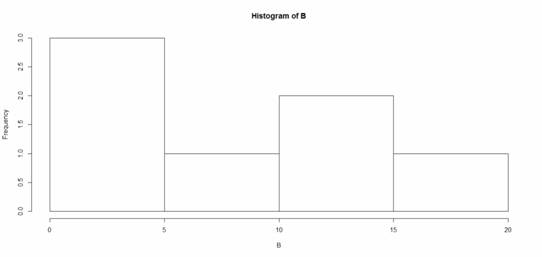
It’s true, and it doesn’t have to be hard to do so. Let’s start with a simple histogram using the hist() command, which is easy to use, but actually quite sophisticated.
First, we set up a vector of numbers and then we create a histogram.
B <- c(2, 4, 5, 7, 12, 14, 16)
hist(B)
That was easy, but you need more from your histogram. (more…)
Someone recently asked me if they need to learn R. In responding, it struck me that this is another way that learning a stat software package is like learning a new language.
The metaphor is extremely helpful for deciding when and how to learn a new stat software, and to keep you going when the going gets rough. (more…)
Let’s create a simple bar chart in R using the barplot() command, which is easy to use.
First, we set up a vector of numbers. Then we count them using the table() command, and then we plot them.
The table() command creates a simple table of counts of the elements in a data set.
H <- c(2,3,3,3,4,5,5,5,5,6)
Now we count the elements using the table() command, as follows: (more…)
Do I really need to learn R?
Someone asked me this recently.
Many R advocates would absolutely say yes to everyone who asks.
I don’t.
(I actually gave her a pretty long answer, summarized here).
It depends on what kind of work you do and the context in which you’re working.
I can say that R is (more…)