What is a Confidence Interval?
Any sample-based findings used to generalize a population are subject to sampling error. In other words, sample statistics won’t exactly match the population parameters they estimate.
One way of dealing with sampling error is to ignore results if there is a chance that they could be due to sampling error. This is the approach adopted with significance tests. Sample effects are treated as being zero if there is more than a 5 percent or 1 percent chance they were produced by sampling error.
Confidence intervals provide a useful alternative to significance tests. Instead of deciding whether the sample data support the devil’s argument that the null hypothesis is true we can take a less cut and dried approach.
We can take a range of values of a sample statistic that is likely to contain a population parameter. A certain percentage (confidence level) of intervals will include the population parameter in the long run (over repeated sampling).
For any given sample size, the wider the confidence interval, the higher the confidence level. If you want a more precise (i.e. narrower) confidence interval, you will have to use a lower level of confidence or use a larger sample.
We might find in a sample that 52 percent of respondents say they intend to vote for Party X at the next election. This figure is the sample estimate.
Since this came from a sample that inevitably has sampling error, we must allow a margin of error. Using the confidence interval, we can estimate the interval within which the population parameter is likely to lie.
This approach avoids the confusing logic of null hypothesis testing and its simplistic significant/not significant dichotomy.
Confidence intervals are a form of inferential analysis and can be used with many descriptive statistics such as percentages, percentage differences between groups, correlation coefficients and regression coefficients.
Like tests of significance, confidence intervals assume that the sample estimates come from a simple random sample. It is inappropriate to use these statistics on data from non-probability samples.
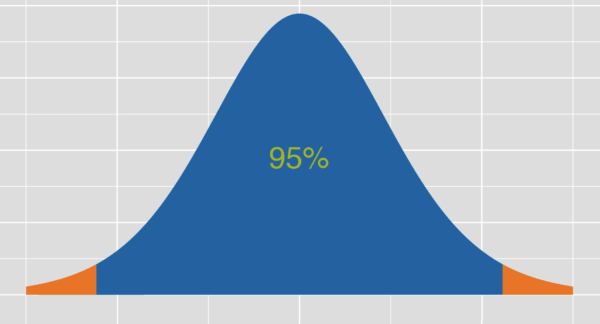
Novice researchers might find themselves in tempting situations to say that they are 95% confident that the confidence interval contains the true value of the population parameter. This is usually not technically correct (at least in frequentist statistics). Rather it is correct to say: Were one to take an infinite number of samples of the same size, on average 95% of them would produce confidence intervals containing the true population value.
Reasons to Use Confidence Intervals Over Significance Tests
Although tests of significance are used more than confidence intervals, many researchers prefer confidence intervals over tests of significance. These reasons include:
1. Confidence intervals provide all the information that a test of statistical significance provides and more.
If, at the 95 percent confidence level, a confidence interval for an effect includes 0 then the test of significance would also indicate that the sample estimate was not significantly different from 0 at the 5 percent level.
2. The confidence interval provides a sense of the size of any effect. The figures in a confidence interval are expressed in the descriptive statistic to which they apply (percentage, correlation, regression, etc.).
This effect size information is missing when a test of significance is used on its own. In our income example the interval estimate for the difference between male and female average incomes was between $2509 and $8088. This gives a sense of roughly what the actual difference is and also of the margin of error of any such difference.
3. Since confidence intervals avoid the term ‘significance’, they avoid the misleading interpretation of that word as ‘important.’
Confidence intervals remind us that any estimates are subject to error and that we can provide no estimate with absolute precision.

Leave a Reply