Have you ever had this happen? You run a regression model. It can be any kind—linear, logistic, multilevel, etc. In the ANOVA table, the effect of interest has a very low p-value. In the regression table, it doesn’t. Or vice-versa.
How can the same effect have two different p-values? In this article, let’s explore when this happens and what it means.
What the statistics in each table measures
The ANOVA table is a table of F tests. It may not be called the ANOVA table on your output, but it always includes a set of F tests. Some software procedures only give one F test for the model as a whole, but most will break it down into a series of F tests, one for each predictor variable or term in your model.
The regression coefficients table is a table of t tests. It includes each regression coefficient, along with its standard error, and usually a t test (some generalized linear models will have Wald or z tests instead, but they have the same role here).
Both tables often list out each predictor variable, along with a p-value for that variable’s conditional effect on Y.
There are two situations in which the p-values will match. Both must be true.
- The F test has one df. This happens in two situations. Either the predictor, X, is numerical or it’s categorical and binary (only two groups).
- The predictor is not involved with any interactions with a variable that is not centered at is mean.
If both of those are true, not only will the p-value match, but the t-statistic in the regression coefficients table will be the positive or negative square root of the F statistic.
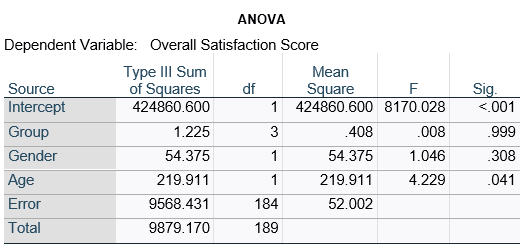
An Example ANOVA Table with Matching and Unmatching Regression Coefficients
Here’s an example of an ANOVA table from a linear regression. In this example, there are four treatment groups, two genders, and age in years (measured continuously and centered at its mean). The response variable, Y, is a satisfaction score with a training. The four groups represented four learning strategies the adult learners were trained to use.
Let’s compare this to the regression coefficients table.
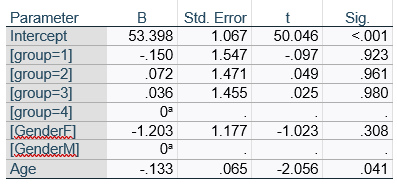
If you compare p-values across the two tables, you can see that Gender and Age have the same p-values, but Group doesn’t.
Gender and Age meet both conditions. Both have 1 df in the F table. Gender because it’s binary (two categories) and Age because it’s numerical). There are no interactions.
Group doesn’t match because it has 3 df in the F test. The F test is testing the null hypothesis that there is no difference among the four means. The t-tests in the regression coefficients table are testing three specific contrasts. Each one compares one group mean to the group 4 mean. For example, the group=1 coefficient tests whether the difference between the mean group 1 satisfaction score differs only from the group 4 score. It’s a different null hypothesis than the F test.
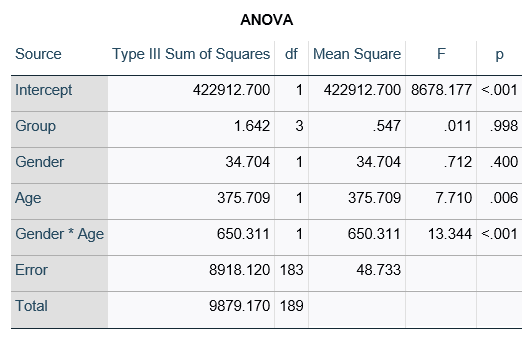
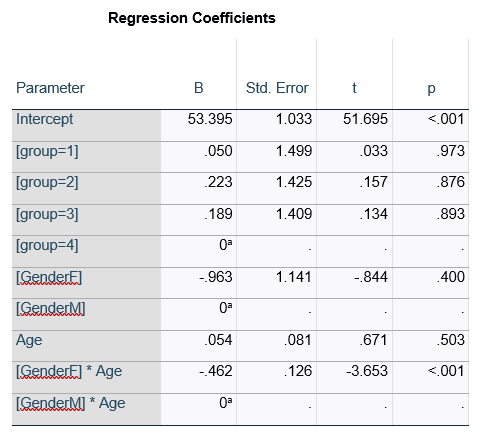
This would be the case whether or not there were interactions in the model that contain Group. Any time you have more that one df in the F test (you can see group has 3), you’ll get as many p-values in the regression coefficients as you have df in the F table. The p-values can’t match because there are more of them in the regression coefficients table.
Gender, which is also categorical, does have the same p-value in both tables. It has 1 df in the F test, which tests the null hypothesis that the two gender means have no variance (they’re the same). Gender is involved in an interaction, so the only reason the hypothesis test, and therefore the p-value, is the same is because the variable it interacts with, Age, is centered.
In conclusion, most of the time, it’s fine if the results don’t match. It’s because the two tables are reporting results of different hypothesis tests, based on what’s in your model.

