The Kappa Statistic or Cohen’s* Kappa is a statistical measure of inter-rater reliability for categorical variables. In fact, it’s almost synonymous with inter-rater reliability.
Kappa is used when two raters both apply a criterion based on a tool to assess whether or not some condition occurs. Examples include:
— Two doctors rate whether or not each of 20 patients has diabetes based on symptoms.
— Two swallowing experts assess whether each of 30 stroke patients has aspirated while drinking based on their cough reaction.
— Two education researchers both assess whether each of 50 children reads proficiently based on a reading evaluation.
If the two-raters can reliably use the criterion to make the same assessment on the same targets, then their agreement will be very high and provide evidence we have reliable ratings. If they can’t, then either the criterion tool isn’t useful or the raters are not well enough trained.
Why not percent agreement
Why not just use percent agreement? The Kappa statistic corrects for chance agreement and percent agreement does not.
Here is a classic example: Two raters rating subjects on a diagnosis of Diabetes.
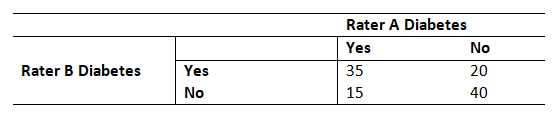
35 times they agree on yes. 40 times they agree on no.
20 disagreements come from Rater B choosing Yes and Rater A choosing no. 15 disagreements come from Rater A choosing Yes and Rater B choosing no.
This table would result in a Kappa of .51 (I won’t go into the formulas).
How High of a Kappa is good Inter-Rater Reliability?
But how do you know if you have a high level of agreement?
An often-heard Rule of Thumb for the Kappa statistic is:
“A Kappa Value of .70 Indicates good reliability”
Where did this originate? Cohen suggested the Kappa statistic be interpreted as:
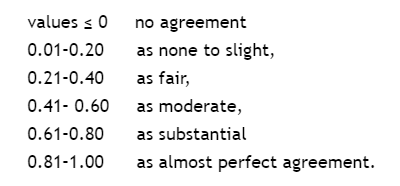
The emphasis is on SUGGESTED.
Other authors have proposed several benchmarks:

It’s very similar to correlation coefficients. There isn’t a clear cut off for what you consider strong, moderate, or weak.
Why can’t we use these rules of thumb as clear cut offs? As with everything in statistics, your decision making depends on the study and the purpose.
For some studies .6 might be acceptable agreement. If you’re looking at physician’s agreement on who should have invasive surgery you pretty much want near-perfect agreement. So these are just general guidelines and it is necessary to consider the goal of the study and the consequences of inaccuracy.
The Kappa Paradox
One more thing to note. Most of the time, Kappa works great to measure agreement. However, there is an interesting situation where percent agreement is very high, but the Kappa statistic is very low. We call this the Kappa paradox.
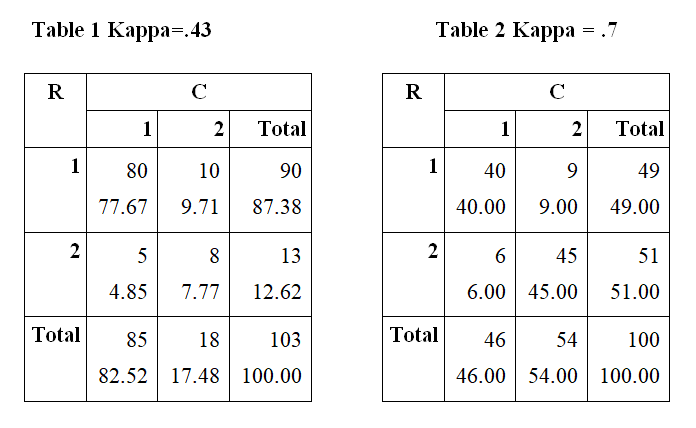
This can happen when nearly everyone or nearly no one is assessed as having the condition. . This affects the marginal totals in the calculation of chance agreement. The percent agreement in both table 1 and table 2 is 85%. However, the Kappa for Table 1 is much lower than for Table 2 because almost all of the agreements are Yeses and there are relatively few nos. I’ve seen situations where a researcher had almost perfect agreement and the Kappa was .31! This is the Kappa paradox.
What have we learned about Kappa? The Kappa statistic is a measure of inter-rater reliability. There is no absolute value for good agreement and depends on the nature of the study. Be aware that in some circumstances it is possible to have great agreement, but a low Kappa.
(*Cohen was a busy guy, he did lots of stuff)
The Kappa calculation for the diabetes raters seems to be incorrect.
With (35+40)/110 = 0.6818 “observed” agreement and (50*55+60*55)/110^2 = 0.5 “chance” agreement,
Cohen’s Kappa would be (1-0.6818)/(1-0.5) = 0.3636??
1. hey , lot of researchers worked to improved this reliability formula. however still not decided which one formula give correct result. furthermore Cohan’s kappa mislead the result in some situation.
Kappa can also be used to assess test – retest reliability. It measures intra-rater reliability at two different time points.
Puspha,
Do you know a paper I can refer to read how a researcher presents his/her inter-coder reliability information in their papers?
1) It seems that the procedures could be applied to more than 2 categories. In fact, I’ve done it. But what guidelines are there for interpretation?
2) Isn’t the “Kappa paradox” the point? A strong reporting bias, or actual low/high frequencies of the condition of interest, results in misleading “% agreement” measures.
3) Related to the last point, if 100% agreement is due to the condition being reported as present/absent 100% of the time for both raters. Kappa is undefined (division by zero). This makes sense! It is impossible to say whether the 100% agreement is due to base rates or the hoped-for actual agreements from two raters seeing and reporting the same reality. 100% agreement could be obtained by two raters that cover their ears and eyes and consistently say “Yes” or “No.”
Love the way you elucidated that point and imbue sensibility into the numerals. Thanks! Much appreciated. At the same time, I`m looking for a paper that I can read to see how other researchers word their inter-coder reliability data. Do you know of a paper I search on Google Scholar?