 Today we see how to set up multiple graphs on the same page. We use the syntax
 par(mfrow=(A,B))
. . . where A refers to the number of rows and B to the number of columns (and where each cell will hold a single graph). This syntax sets up a plotting environment of A rows and B columns.
First we create four vectors, all of the same length.
X <- c(1, 2, 3, 4, 5, 6, 7)
Y1 <- c(2, 4, 5, 7, 12, 14, 16)
Y2 <- c(3, 6, 7, 8, 9, 11, 12)
Y3 <- c(1, 7, 3, 2, 2, 7, 9)
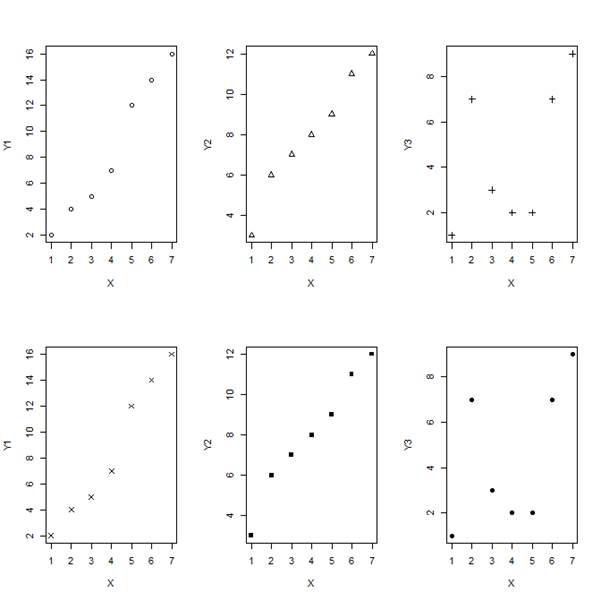
Now we set up a plotting environment of two rows and three columns (in order to hold six graphs), using par(mfrow())
par(mfrow=c(2,3))
Now we plot six graphs on the same plotting environment. We use the plot() command six times in succession, each time graphing one of the Y vectors against the X vector.
plot(X,Y1, pch = 1)
plot(X,Y2, pch = 2)
plot(X,Y3, pch = 3)
plot(X,Y1, pch = 4)
plot(X,Y2, pch = 15)
plot(X,Y3, pch = 16)
Out plot looks like this:
That wasn’t so hard! In our next blog post we will learn about some useful commands for exploring data in R.
About the Author: David Lillis has taught R to many researchers and statisticians. His company, Sigma Statistics and Research Limited, provides both on-line instruction and face-to-face workshops on R, and coding services in R. David holds a doctorate in applied statistics.
See our full R Tutorial Series and other blog posts regarding R programming.

Hello,
Is there a way to do this for a very large data set so that you don’t have to type in
plot(X,Y3, pch = 16)…. and so on.
I want a way to generate scatter plots for all columns (y=column heading) against the treatments (x=treatments).
Thanks so much.
Thanks.
Is there any way we can change the margin of the plots? i mean They all have same border and margins atm, I want one of my plots to have less space.
Is there a way to write a name for all plots? E.g. in your example how could one write “Two rows of Y plots” on top of the plot/file?
You can add
main = “your proposed title”
within your plot command
e.g.:
plot(X,Y, main=”title”)
Thank you. Is there a way, where multiple graphs can be plotted in the same x & y axis?
You want
par(new=F)
This will not erase the existing plot before drawing the new one. Note however that it does not attempt to scale the overlaid plot to the existing one – you can either use different y-axes on either side of the plot, or scale the overlaid plot yourself. Otherwise your new plot will be the right shape, but appear to have the wrong y-values.