The following statement might surprise you, but it’s true.
To run a linear model, you don’t need an outcome variable Y that’s normally distributed. Instead, you need a dependent variable that is:
- Continuous
- Unbounded
- Measured on an interval or ratio scale
The normality assumption is about the errors in the model, which have the same distribution as Y|X. It’s absolutely possible to have a skewed distribution of Y and a normal distribution of errors because of the effect of X. (more…)
We’ve looked at the interaction effect between two categorical variables. Now let’s make things a little more interesting, shall we?
What if our predictors of interest, say, are a categorical and a continuous variable? How do we interpret the interaction between the two? (more…)
One of the most common—and one of the trickiest—challenges in data analysis is deciding how to include multiple predictors in a model, especially when they’re related to each other.

Let’s say you are interested in studying the relationship between work spillover into personal time as a predictor of job burnout.
You have 5 categorical yes/no variables that indicate whether a particular symptom of work spillover is present (see below).
While you could use each individual variable, you’re not really interested if one in particular is related to the outcome. Perhaps it’s not really each symptom that’s important, but the idea that spillover is happening.
(more…)
In a previous article, we discussed how incidence rate ratios calculated in a Poisson regression can be determined from a two-way table of categorical variables.
Statistical software can also calculate the expected (aka predicted) count for each group. Below is the actual and expected count of the number of boys and girls participating and not participating in organized sports.
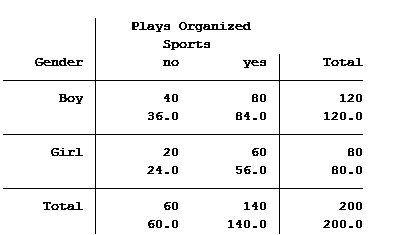
The value in the top of each cell is the actual count (40 boys do not play organized sports) and the bottom value is the expected/predicted count (36 boys are predicted to not play organized sports).
The Poisson model that we ran in the previous article generated the following table: (more…)
The concept of a statistical interaction is one of those things that seems very abstract. Obtuse definitions, like this one from Wikipedia, don’t help:
In statistics, an interaction may arise when considering the relationship among three or more variables, and describes a situation in which the simultaneous influence of two variables on a third is not additive. Most commonly, interactions are considered in the context of regression analyses.
First, we know this is true because we read it on the internet! Second, are you more confused now about interactions than you were before you read that definition? (more…)
A data set can contain indicator (dummy) variables, categorical variables and/or both. Initially, it all depends upon how the data is coded as to which variable type it is.
For example, a categorical variable like marital status could be coded in the data set as a single variable with 5 values: (more…)