by Manolo Romero Escobar
General Linear Model (GLM) is a tool used to understand and analyse linear relationships among variables. It is an umbrella term for many techniques that are taught in most statistics courses: ANOVA, multiple regression, etc.
In its simplest form it describes the relationship between two variables, “y” (dependent variable, outcome, and so on) and “x” (independent variable, predictor, etc). These variables could be both categorical (how many?), both continuous (how much?) or one of each.
Moreover, there can be more than one variable on each side of the relationship. One convention is to use capital letters to refer to multiple variables. Thus Y would mean multiple dependent variables and X would mean multiple independent variables. The most known equation that represents a GLM is:
Y = BX + E
Y represents the “dependent” variables (a.k.a. “outcomes”) which in the most simple (i.e. univariate) case has only one element.
Β are the weights (“loadings”, “effects”) of the “independent” variables to predict the Ys. Again, in the simple of cases it would contain:
β0 the “intercept”: The mean value of y when the x takes a value of zero.
β1 the weight or effect of the first predictor (x1).
X are the “independent” variables, in our simple case it has two values 1 and x1.
Finally, E, are the errors (aka, disturbance terms or residuals), which are what is left to be explained of the Ys after accounting for the intercept and the effect of the Xs.
The nature of the error term is one of the fundamental aspects of GLM. The general method used to estimate the β parameters (Ordinary Least Squares, OLS) minimizes the errors, which are normally distributed with a mean of zero and a variance (aka “residual variance”, or “error variance”) of σ².
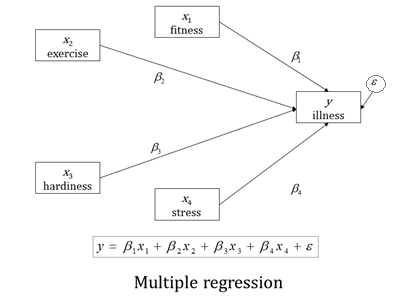
Find below an example of a path diagram representing a multiple regression of an outcome “y” regressed on four predictors “x”.
You will notice that each x predictor variable has a path drawn to y, representing its effect on y. This effect is measured by the coefficient.
And how does this way of presenting GLM help us understand SEM?
SEM makes it very clear, visually, which variables are the predictors and which are the outcomes. In a linear regression, all the variables in our equation are directly measured and depicted in rectangles. The only one that isn’t is the error term, ε, which is in an oval.
Like all latent variables, the error isn’t directly measured in our data set. It is inferred from the set of residuals and we’re able to measure its variance.
By setting up the regression model this way, we can now test many different relationships among the variables by expanding the model. We could add more paths to test mediation or add in other latent variables, measured by observed indicators.
These models can be very complicated, but the building blocks of predictors, outcome variables, error terms, and effects measured by coefficients are always present.
Thus, understanding GLM, and multiple regression in particular, is one of the requirements to successfully fitting SEM to your data.
********

E. Manolo Romero Escobar is a Senior Psychometrician at Multi-Health Systems Inc (a psychological test publishing company) in Toronto.
He has extensive expertise in factor analytical and latent-trait methods of measurement, as well as applications of linear mixed effects to nested, longitudinal, unbalanced data.

Dear Karen,
I think you should be careful to prevent confusion between the error term or disturbance and the residuals. The former (denoted with the Greek epsilon in your figure) is a latent variable. The latter is its calculated (and therefore observed) sample estimate. This is not just a semantic question, as is implicitly ackowledged by the following sentence:
“the error isn’t directly measured in our data set. It is inferred from the set of residuals and we’re able to measure its variance”
(where the last “measure” actually means “estimate”). You can only infer something from the “residuals” if they are indeed observable.
Also, IMO it is not very correct to state “OLS minimizes the errors”; OLS has no control over the errors. It would be clearer and more accurate to state “OLS minimizes the sum of squared RESIDUALS”.