new blog post: Member Training: The Dark Side of Data Science

Previous Posts
The Cox regression model has a fairly minimal set of assumptions, but how do you check those assumptions and what happens if those assumptions are not satisfied?
Parametric models for survival data don’t work well with the normal distribution. The distributions that work well for survival data include the exponential, Weibull, gamma, and lognormal distributions among others. These distributions give you a broad range of hazard functions...
Survival analysis isn't just a single model. It's a whole set of tests, graphs, and models that are all used in slightly different data and study design situations. Choosing the most appropriate model can be challenging. In this article I will describe the most common types of tests and models in survival analysis, how they differ, and some challenges to learning them.
In this webinar you will learn what these variables are, introduce the relationships between the Poisson, Bernoulli, Binomial, and Normal distributions, and see an example of how to actually set up the data and specify and interpret the logistic model for these kinds of variables.
There are two features of survival models. First is the process of measuring the time in a sample of people, animals, or machines until a specific event occurs. In fact, many people use the term “time to event analysis” or “event history analysis” instead of “survival analysis” to emphasize the broad range of areas where you can apply these techniques.
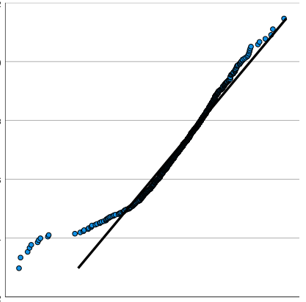
Every statistical model and hypothesis test has assumptions. And yes, if you’re going to use a statistical test, you need to check whether those assumptions are reasonable to whatever extent you can. Some assumptions are easier to check than others. Some are so obviously reasonable that you don’t need to do much to check them […]
You show this table in your PowerPoint presentation because you know your audience is expecting some statistics, though they don’t really understand them. You begin by explaining that the constant (_cons) represents the mean BMI of small frame women. You have now lost half of your audience because they have no idea why the constant represents small frame women. By the time you start explaining the interaction you have lost 95% of your audience.
In this webinar you will learn what these variables are, introduce the relationships between the Poisson, Bernoulli, Binomial, and Normal distributions, and see an example of how to actually set up the data and specify and interpret the logistic model for these kinds of variables.
After you are done with the odyssey of exploratory factor analysis (aka a reliable and valid instrument)…you may find yourself at the beginning of a journey rather than the ending. The process of performing exploratory factor analysis usually seeks to answer whether a given set of items form a coherent factor (or often several factors). […]
Anytime we want to measure something in science we have to take into account that our measurements contains various kinds of error. That error can be random and/or systematic. So what we want to do in our statistical approach to the data is to isolate the true score in a variable and remove the error. This is really what we're trying to do using latent variables for measurement.
 stat skill-building compass