Previous Posts
Sample size estimates are one of those data analysis tasks that look straightforward, but once you try to do one, make you want to bang your head against the computer in frustration. Or, maybe that's just me. Regardless of how they make you feel, they are super important to do for your study before you collect the data.
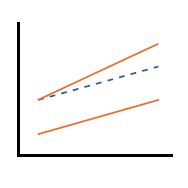
We get many questions from clients who use the terms mediator and moderator interchangeably. They are easy to confuse, yet mediation and moderation are two distinct terms that require distinct statistical approaches. The key difference between the concepts can be compared to a case where a moderator lets you know when an association will occur […]
So we’ve looked at the interaction effect between two categorical variables. But let’s make things a little more interesting, shall we? What if our predictors of interest, say, are a categorical and a continuous variable? How do we interpret the interaction between the two? We’ll keep working with our trusty 2014 General Social Survey data set. But this time let’s examine the impact of job prestige level (a continuous variable) and gender (a categorical, dummy coded variable) as our two predictors.
A research study rarely involves just one single statistical test. And multiple testing can result in statistically significant findings just by chance. After all, with the typical Type I error rate of 5% used in most tests, we are allowing ourselves to “get lucky” 1 in 20 times for each test. When you figure out the probability of Type I error across all the tests, that probability skyrockets. There are a number of ways to control for this chance significance. And as with most things statistical, determining a viable adjustment to control for the chance significance depends on what you are doing. Some approaches are good. Some are not so good. And, sometimes an adjustment isn’t even necessary. In this webinar, Elaine Eisenbeisz will provide an overview of multiple comparisons and why they can be a problem.
One important yet difficult skill in statistics is choosing a type model for different data situations. One key consideration is the dependent variable. For linear models, the dependent variable doesn’t have to be normally distributed, but it does have to be continuous, unbounded, and measured on an interval or ratio scale. Percentages don’t fit these criteria. Yes, they’re continuous and ratio scale. The issue is the boundaries at 0 and 100. Likewise, counts have a boundary at 0 and are discrete, not continuous. The general advice is to analyze these with some variety of a Poisson model. Yet there is a very specific type of variable that can be considered either a count or a percentage, but has its own specific distribution.
When I was in graduate school, stat professors would say “ANOVA is just a special case of linear regression.” But they never explained why. And I couldn’t figure it out. The model notation is different. The output looks different. The vocabulary is different. The focus of what we’re testing is completely different. How can they […]
Have you ever heard that “2 tall parents will have shorter children”? This phenomenon, known as regression to the mean, has been used to explain everything from patterns in hereditary stature (as Galton first did in 1886) to why movie sequels or sophomore albums so often flop. So just what is regression to the mean (RTM)?
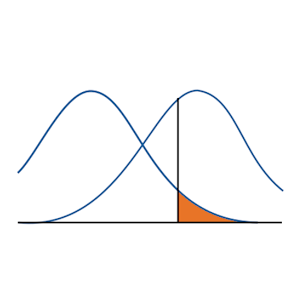
Statistics is, to a large extent, a science of comparison. You are trying to test whether one group is bigger, faster, or smarter than another. You do this by setting up a null hypothesis that your two groups have equal means or proportions and an alternative hypothesis that one group is “better” than the other. The test has interesting results only when the data you collect ends up rejecting the null hypothesis. But there are times when the interesting research question you're asking is not about whether one group is better than the other, but whether the two groups are equivalent.
Most of the p-values we calculate are based on an assumption that our test statistic meets some distribution. These distributions are generally a good way to calculate p-values as long as assumptions are met. But it’s not the only way to calculate a p-value. Rather than come up with a theoretical probability based on a distribution, exact tests calculate a p-value empirically. The simplest (and most common) exact test is a Fisher’s exact for a 2x2 table. Remember calculating empirical probabilities from your intro stats course? All those red and white balls in urns? The calculation of empirical probability starts with the number of all the possible outcomes.
How do you choose between Poisson and negative binomial models for discrete count outcomes? One key criterion is the relative value of the variance to the mean after accounting for the effect of the predictors. A previous article discussed the concept of a variance that is larger than the model assumes: overdispersion. (Underdispersion is also […]


 stat skill-building compass