new blog post: Member Training: The Dark Side of Data Science

Previous Posts
Meta-analysis is the quantitative pooling of data from multiple studies. Meta-analysis done well has many strengths, including statistical power, precision in effect size estimates, and providing a summary of individual studies. But not all meta-analyses are done well.
Predictor variables in statistical models can be treated as either continuous or categorical. Usually, this is a very straightforward decision about which way to specify each predictor. Categorical predictors, like treatment group, marital status, or highest educational degree should be specified as categorical. Likewise, continuous predictors, like age, systolic blood pressure, or percentage of ground cover should be specified as continuous. But there are numerical predictors that aren’t continuous. And these can sometimes make sense to treat as continuous or sometimes make sense as categorical.
One of the most important concepts in data analysis is that the analysis needs to be appropriate for the scale of measurement of the variable. The focus of these decisions about scale tends to focus on levels of measurement: nominal, ordinal, interval, ratio. These levels of measurement tell you about the amount of information in the variable. But there are other ways of distinguishing the scales that are also important and often overlooked.
Suppose you are asked to create a model that will predict who will drop out of a program your organization offers. You decide you will use a binary logistic regression because your outcome has two values: “0” for not dropping out and “1” for dropping out. Most of us were trained in building models for the purpose of understanding and explaining the relationships between an outcome and a set of predictors. But model building works differently for purely predictive models. Where do we go from here?
What statistical model would you use for longitudinal data to analyze between-subject differences with within-subject change? Most analysts would respond, “a mixed model,” but have you ever heard of latent growth curves? How about latent trajectories, latent curves, growth curves, or time paths, which are other names for the same approach?
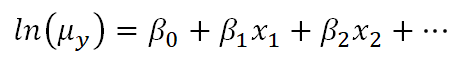
Generalized linear models—and generalized linear mixed models—are called generalized linear because they connect a model’s outcome to its predictors in a linear way. The function used to make this connection is called a link function. Link functions sounds like an exotic term, but they’re actually much simpler than they sound.
Like any applied skill, mastering statistical analysis requires: 1. building a body of knowledge 2. adeptness of the tools of the trade (aka software package) 3. practice applying the knowledge and using the tools in a realistic, meaningful context.
In fixed-effects models (e.g., regression, ANOVA, generalized linear models), there is only one source of random variability. This source of variance is the random sample we take to measure our variables. It may be patients in a health facility, for whom we take various measures of their medical history to estimate their probability of recovery. Or random variability may come from individual students in a school system, and we use demographic information to predict their grade point averages.
If you are new to using generalized linear mixed effects models, or if you have heard of them but never used them, you might be wondering about the purpose of a GLMM. Mixed effects models are useful when we have data with more than one source of random variability. For example, an outcome may be measured more than once on the same person (repeated measures taken over time). When we do that we have to account for both within-person and across-person variability. A single measure of residual variance can’t account for both.
In this webinar, we will provide an overview of generalized linear models. You may already be using them (perhaps without knowing it!). For example, logistic regression is a type of generalized linear model that many people are already familiar with. Alternatively, maybe you’re not using them yet and you are just beginning to understand when they might be useful to you.
 stat skill-building compass