
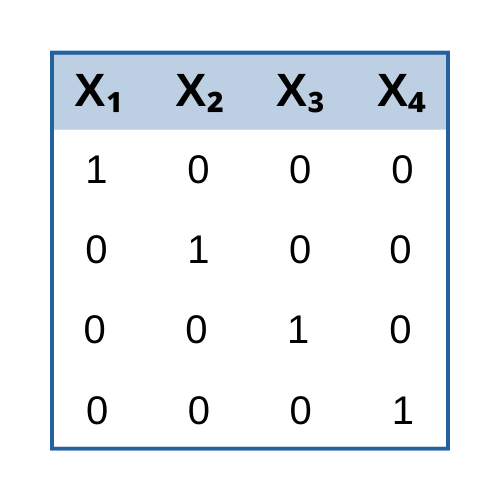
new blog post: Member Training: Dummy and Effect Coding
Previous Posts
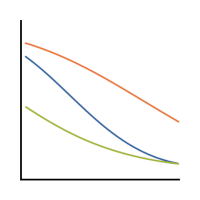
What do you do if the assumptions of linear models are violated?
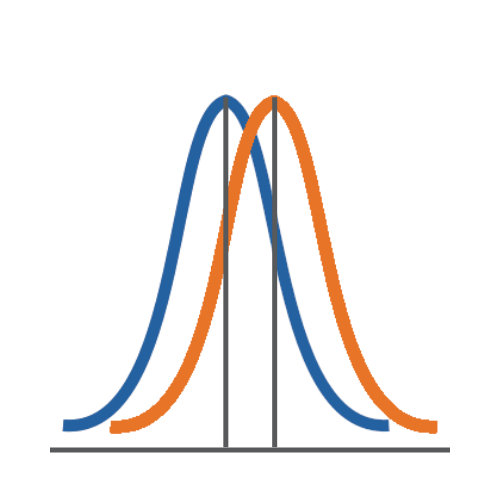
Effect size statistics are all the rage these days. Journal editors are demanding them. Committees won't pass dissertations without them. But the reason to compute them is not just that someone wants them -- they can truly help you understand your data analysis.
One of the most difficult steps in calculating sample size estimates is determining the smallest scientifically meaningful effect size. Here's the logic: The power of every significance test is based on four things: the alpha level, the size of the effect, the amount of variation in the data, and the sample size. The effect size in question will be measured differently, depending on which statistical test you're performing.

Exact and randomization tests are simple from a conceptual level and need fewer assumptions than traditional parametric tests. They do require substantial computing power, but nothing that can’t be handled by the computer you have today.
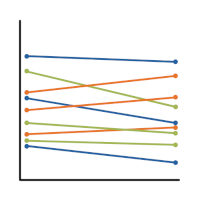
In repeated measures data, the dependent variable is measured more than once for each subject. Usually, there is some independent variable (often called a within-subject factor) that changes with each measurement. And in longitudinal data, the dependent variable is measured at several time points for each subject, often over a relatively long period of time.
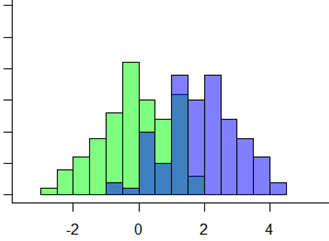
If you’ve ever run a one-way analysis of variance (ANOVA), you’re familiar with post-hoc tests. The ANOVA omnibus test only tells you whether any groups differ in their means. But if you want to explore which specific group mean is different from which, you need to follow up with a post-hoc test.
Interactions in statistical models are never especially easy to interpret. Throw in non-normal outcome variables and non-linear prediction functions and they become even more difficult to understand.
One big advantage of R is its breadth. If anything has been done in statistics, there is an R package that will do it. The problem is that sometimes there are four packages that will do it. This is big problem with R (and with Python for that matter).
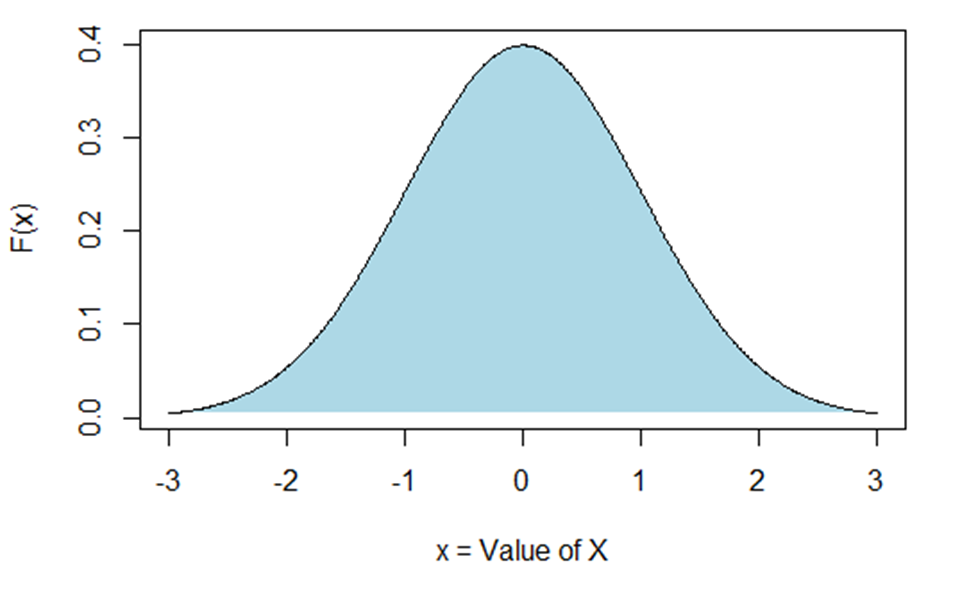
When you need to compare a numeric outcome for two groups, what analysis do you think of first? Chances are, it’s the independent samples t-test. But that’s not the only, or always, the best option. In many situations, the Mann-Whitney U test is a better option. The non-parametric Mann-Whitney U test is also called the […]

Many data sets are challenging and time consuming to work with because the data are seldom in an optimal format.
 stat skill-building compass