new blog post: Member Training: The Dark Side of Data Science

Previous Posts
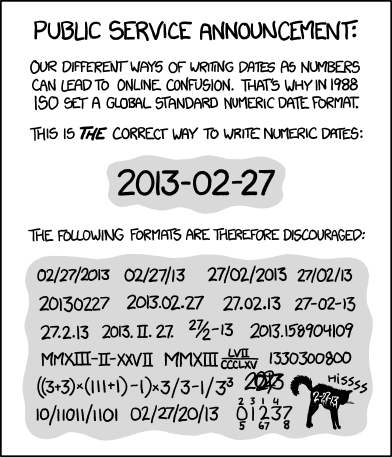
Formatting Date Variables seems like it should be straightforward, but sadly, it’s not. If you are given data that includes dates, expect confusion. Dates can be represented in many different ways.

Moderated mediation, also known as Conditional Process Modeling, is great tool for understanding one type of complex relationship among variables.
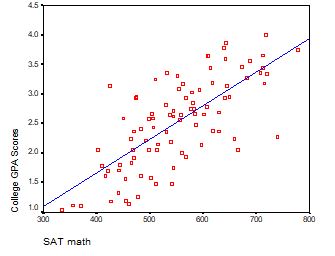
How do you interpret the intercept in a regression model? The intercept is the expected mean value of Y when all X=0. This has different meanings, depending on the scale of X.
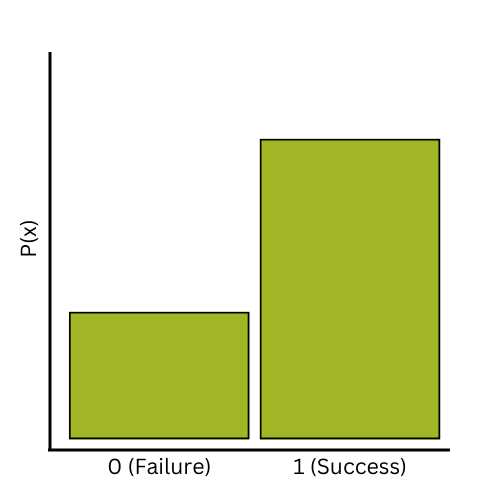
You might already be familiar with the binomial distribution. It describes the scenario where the result of an observation is binary—it can be one of two outcomes. You might label the outcomes as “success” and “failure” (or not!).
If you’ve used much analysis of variance (ANOVA), you’ve probably heard that ANOVA is a special case of linear regression. Unless you’ve seen why, though, that may not make a lot of sense. After all, ANOVA compares means between categories, while regression predicts outcomes with numeric variables.
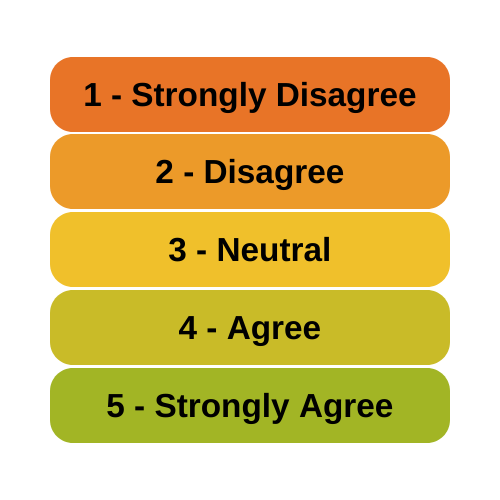
A very common question is whether it is legitimate to use Likert scale data in parametric statistical procedures that require interval data, such as Linear Regression, ANOVA, and Factor Analysis. A typical Likert scale item has 5 to 11 points that indicate the degree of something. For example, it could measure agreement with a statement, […]
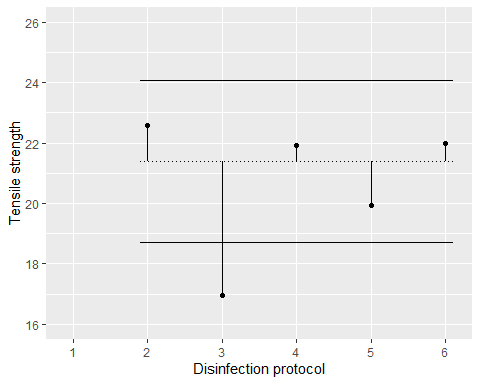
I’m a big fan of Analysis of Variance (ANOVA). I use it all the time. I learn a lot from it. But sometimes it doesn’t test the hypothesis I need. In this article, we’ll explore a test that is used when you care about a specific comparison among means: Dunnett’s test.
Data analysts can get away without ever understanding matrix algebra, certainly. But there are times when having even a basic understanding of how matrix algebra works and what it has to do with data can really make your analyses make a little more sense.

At some point, if you want to do serious data analysis, you have to start using syntax. Or you'll waste time, make errors, and not even know it. The good news is that SPSS makes it extremely easy to get started learning and getting the benefits of using syntax without having to spend endless days in front of a manual. And this series will guide you on your journey to becoming a master syntax writer.
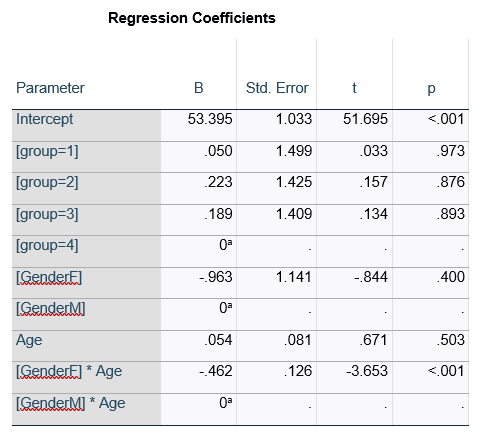
Have you ever had this happen? You run a regression model. It can be any kind—linear, logistic, multilevel, etc. In the ANOVA table, the effect of interest has a very low p-value. In the regression table, it doesn’t. Or vice-versa. How can the same effect have two different p-values? In this article, let’s explore when […]
 stat skill-building compass