new blog post: Member Training: The Dark Side of Data Science

Previous Posts

There’s no mincing words here. Missing values can cause problems for every statistician. That’s true for a lot of reasons, but it can start with simple issues of choices made when coding missing values in a data set. Here are a few examples. Example 1: The Null License Plate Researcher Joseph Tartaro thought it would […]
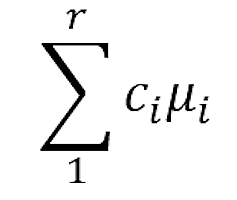
When you learned analysis of variance (ANOVA), it’s likely that the emphasis was on the ANOVA table, with its Sums of Squares and F tests, followed by a post-hoc test. But ANOVA is quite flexible in how it can compare means. A large part of that flexibility comes from its ability to perform many types […]
In part 2 of this series, we got started on the various menus in Stata. This post covers an important menu that you’ll probably use often: the graphics menu. What’s in the Graphics menu The graphics menu provides an impressive variety of options for creating just about any graph you might need. Take a look […]
How do you know which method to use when you want to compare groups?

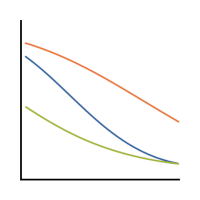
The classic way to compare means in analysis of variance is examining pairwise differences in means after an F test.. It’s great for many problems, but sometimes your research question isn’t about pairwise differences. Pairwise differences are not ideal if your research question is if, like the Sesame Street song, one of these groups is […]
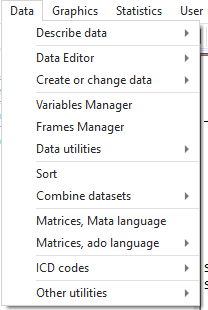
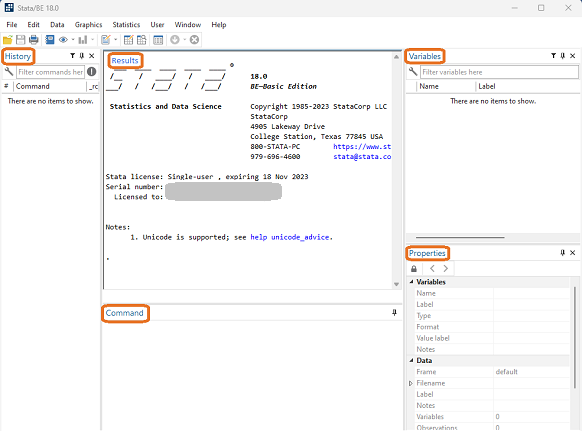
A great way to get started with Stata is using its menus. The first part of this Tutorial Series introduced you to Stata’s windows. You can now begin learning how to use Stata to work with data. Across the top are 8 tabs: File, Edit, Data, Graphics, Statistics, User, Window, and Help. We will not […]
One of the hardest steps in any project is learning to ask the right research question!
Designing experiments would always be simple if we could just randomly assign subjects to different treatment conditions with no other restrictions. Unfortunately, that doesn’t always work. For example, there are many experimental situations where the subjects aren’t independent of each other. The subjects that are related to each other are combined into clusters called “blocks.” […]
So, you want to get started with Stata? Good choice! At The Analysis Factor we recommend first becoming proficient in one statistical software. Then once you’ve progressed up to learning Stage 3 skills, adding a second statistical software. Whether it’s your first, second, or 5th statistical software, Stata has a lot that makes it worth […]
What do you do if the assumptions of linear models are violated?
 stat skill-building compass