new blog post: Member Training: The Dark Side of Data Science

Previous Posts
If you have run mixed models much at all, you have undoubtedly been haunted by some version of this very obtuse warning: “The Hessian (or G or D) Matrix is not positive definite. Convergence has stopped.” Or “The Model has not Converged. Parameter Estimates from the last iteration are displayed.” What on earth does that mean?
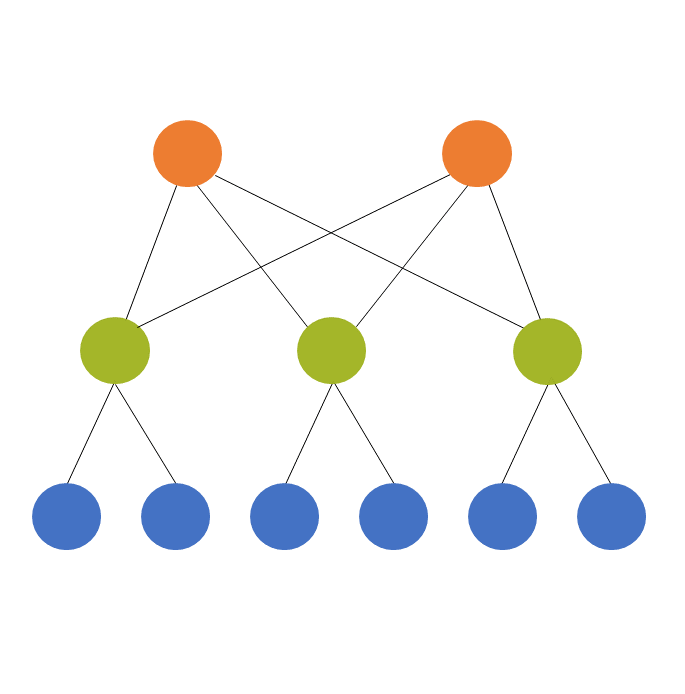
One of those tricky, but necessary, concepts in statistics is the difference between crossed and nested factors. As a reminder, a factor is any categorical independent variable. In experiments, or any randomized designs, these factors are often manipulated. Experimental manipulations (like Treatment vs. Control) are factors. Observational categorical predictors, such as gender, time point, poverty […]

In statistical practice, there are many situations where best practices are clear. There are many, though, where they aren’t. The granddaddy of these practices is adjusting p-values when you make multiple comparisons. There are good reasons to do it and good reasons not to. It depends on the situation. At the heart of the issue […]
There are not a lot of statistical methods designed just to analyze ordinal variables. But that doesn’t mean that you’re stuck with few options. There are more than you’d think. Some are better than others, but it depends on the situation and research questions. Here are five options when your dependent variable is ordinal.
In many repeated measures data situations, you will need to set up the data different ways for different parts of the analyses. This article will outline one of the issues in data set up: using the long vs. the wide data format.
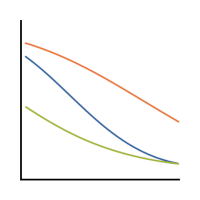
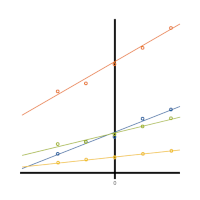
Interactions in statistical models are never especially easy to interpret. Throw in non-normal outcome variables and non-linear prediction functions and they become even more difficult to understand.
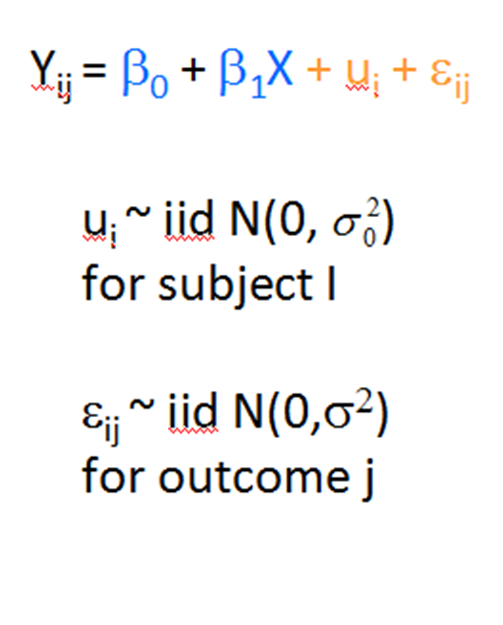
Learning Multilevel Models is hard enough. Even worse if you don't have a good background in linear regression. This article outlines 4 must-know concepts.
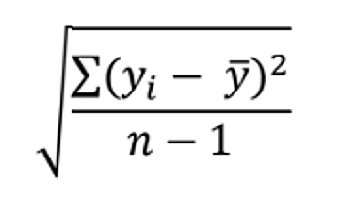
Standard deviation and standard error are statistical concepts you probably learned well enough in Intro Stats to pass the test. Conceptually, you understand them, yet the difference doesn’t make a whole lot of intuitive sense. So in this article, let’s explore the difference between the two. We will look at an example, in the hopes […]
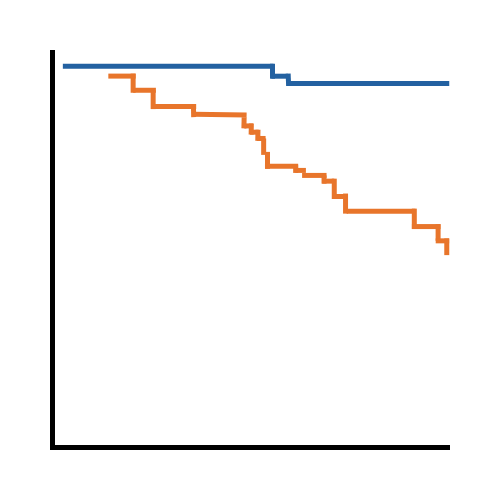
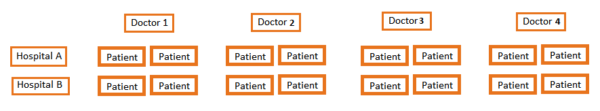
Most survival analysis models for time-to-event data, like Cox regression, assume independence. The survival time for one individual cannot influence the survival time for another. This assumption doesn’t hold in many study designs. You may have animals clustered into litters, matched pairs, or patients in a multi-center trial with correlated survival times within a center.
When you hear about multilevel models or mixed models, you very often think of a nested design. Level 1 units nested in Level 2 units, which are in turn possibly nested in Level 3 units. But these variables that define the units and that become random factors in the model can, in fact, be crossed […]
 stat skill-building compass