You may have never heard of listwise deletion for missing data, but you’ve probably used it without knowing it. Even when it doesn’t work well. 
Listwise deletion means that any case in a data set is deleted from an analysis if they’re missing data on any variable in the analysis.
It’s the default in most statistical software packages.
Although its simplicity is a major advantage, it causes big problems in many missing data situations.
But…not always. If you happen to have one of the uncommon missing data situations in which (more…)
In a statistical model–any statistical model–there is generally one way that a predictor X and a response Y can relate:
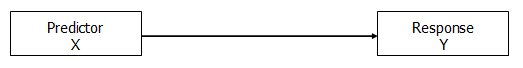
This relationship can take on different forms, of course, like a line or a curve, but there’s really only one relationship here to measure.
Usually the point is to model the predictive or explanatory ability, the effect, of X on Y.
In other words, there is a clear response variable*, although not necessarily a causal relationship. We could have switched the direction of the arrow to indicate that Y predicts X. Or used a two-headed arrow to show a correlation, with no direction, but that’s a whole other story.
For our purposes, Y is the response variable and X the predictor.
But a third variable–another predictor–can relate to X and Y in a number of different ways. How this predictor relates to X and Y changes how we interpret the relationship between X and Y. (more…)
 Someone recently asked me if they need to learn R. In responding, it struck me that this is another way that learning a stat software package is like learning a new language.
The metaphor is extremely helpful for deciding when and how to learn a new stat software, and to keep you going when the going gets rough. (more…)
Let’s create a simple bar chart in R using the barplot() command, which is easy to use.
First, we set up a vector of numbers. Then we count them using the table() command, and then we plot them.
The table() command creates a simple table of counts of the elements in a data set.
H <- c(2,3,3,3,4,5,5,5,5,6)
Now we count the elements using the table() command, as follows: (more…)
Understanding moderation is one of those topics in statistics that is so much harder than it needs to be.
Here are three suggestions to make it just a little easier.
1. Realize that moderation just means an interaction
I have spoken with a number of researchers who are surprised to learn that moderation is just another term for interaction.
Perhaps it’s because moderation often appears with discussions of mediation. Or because we tend to think of interaction as being part of ANOVA, but not regression.
In any case, both an interaction and moderation mean the same thing: the effect of one predictor on a response variable is different at different values of the second predictor. (more…)
Do I really need to learn R?
Someone asked me this recently.
Many R advocates would absolutely say yes to everyone who asks.
I don’t.
(I actually gave her a pretty long answer, summarized here).
It depends on what kind of work you do and the context in which you’re working.
I can say that R is (more…)