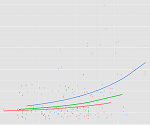
It’s really easy to mix up the concepts of association (as measured by correlation) and interaction. Or to assume if two variables interact, they must be associated. But it’s not actually true.
In statistics, they have different implications for the relationships among your variables. This is especially true when the variables you’re talking about are predictors in a regression or ANOVA model.

Association
Association between two variables means the values of one variable relate in some way to the values of the other. It is usually measured by correlation for two continuous variables and by cross tabulation and a Chi-square test for two categorical variables.
Unfortunately, there is no nice, descriptive measure for association between one (more…)
Last month I did a webinar on Poisson and negative binomial models for count data. With a few hundred participants, we ran out of time to get through all the questions, so I’m answering some of them here on the blog.
This set of questions are all related to when it’s appropriate to treat count data as continuous and run the more familiar and simpler linear model.
Q: Do you have any guidelines or rules of thumb as far as how many discrete values an outcome variable can take on before it makes more sense to just treat it as continuous?
The issue usually isn’t a matter of how many values there are. (more…)
Centering predictor variables is one of those simple but extremely useful practices that is easily overlooked.
It’s almost too simple.
Centering simply means subtracting a constant from every value of a variable. What it does is redefine the 0 point for that predictor to be whatever value you subtracted. It shifts the scale over, but retains the units.
The effect is that the slope between that predictor and the response variable doesn’t (more…)
I recently received this great question:
Question:
Hi Karen, ive purchased a lot of your material and read a lot of your pdf documents w.r.t. regression and interaction terms. Its, now, my general understanding that interaction for two or more categorical variables is best done with effects coding, and interactions cont v. categorical variables is usually handled via dummy coding. Further, i may mess this up a little but hopefully you’ll get my point and more importantly my question, i understand that
1) given a fitted line Y = b0 + b1 x1 + b2 x2 + b3 x1*x2, the interpretation for b3 is the diff of the effect of x1 on Y, when x2 changes one unit, if x1 and x2 are cont. ( also interpretation can be reversed in terms of x1 and x2). (more…)
“Everything should be made as simple as possible, but no simpler” – Albert Einstein*
For some reason, I’ve heard this quotation 3 times in the past 3 days. Maybe I hear it everyday, but only noticed because I’ve been working with a few clients on model selection, and deciding how much to simplify a model.
And when the quotation fits, use it. (That’s the saying, right?)
*For the record, a quick web search indicated this may be a paraphrase, but it still applies.
The quotation is the general goal of model selection. You really do want the model to be as simple as possible, but still able to answer the research question of interest.
This applies to many areas of model selection. Here are a few examples: (more…)
Need to dummy code in a Cox regression model?
Interpret interactions in a logistic regression?
Add a quadratic term to a multilevel model?
 This is where statistical analysis starts to feel really hard. You’re combining two difficult issues into one.
You’re dealing with both a complicated modeling technique at Stage 3 (survival analysis, logistic regression, multilevel modeling) and tricky effects in the model (dummy coding, interactions, and quadratic terms).
The only way to figure it all out in a situation like that is to break it down into parts. (more…)


 This is where statistical analysis starts to feel really hard. You’re combining two difficult issues into one.