There’s a common saying among pediatricians: children are not little adults. You can’t take a drug therapy that works in adults and scale it down to a kid-sized treatment.
Children are actively growing. Their livers metabolize drugs differently, and they have a stage of life called puberty that many of us have long forgotten.
Likewise, pilot studies are not little research studies. Please do not take a poorly funded clinical trial and try to sneak your inadequate sample size through peer review by calling it a pilot.
(more…)
Effect size statistics are all the rage these days.
Journal editors are demanding them. Committees won’t pass dissertations without them.
But the reason to compute them is not just that someone wants them — they can truly help you understand your data analysis.
What Is an Effect Size Statistic?
And yes, these definitely qualify. But the concept of an effect size statistic is actually much broader. Here’s a description from a nice article on effect size statistics:
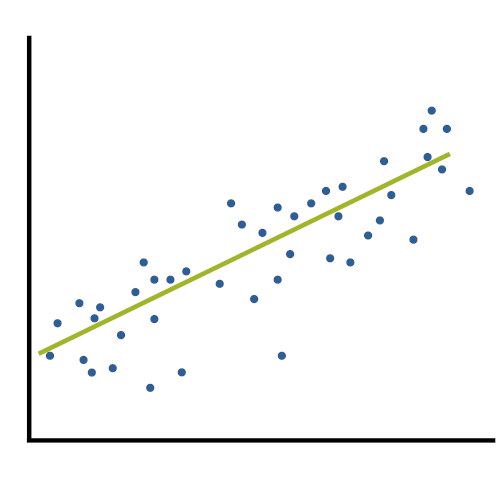
If you think about it, many familiar statistics fit this description. Regression coefficients give information about the magnitude and direction of the relationship between two variables. So do correlation coefficients. (more…)
One of the most difficult steps in calculating sample size estimates is determining the smallest scientifically meaningful effect size.
Here’s the logic:
The power of every significance test is based on four things: the alpha level, the size of the effect, the amount of variation in the data, and the sample size.
You will measure the effect size in question differently, depending on which statistical test you’re performing. It could be a mean difference, a difference in proportions, a correlation, regression slope, odds ratio, etc.
When you’re planning a study and estimating the sample size needed for (more…)
Spoiler alert, real data are seldom normally distributed. How does the population distribution influence the estimate of the population mean and its confidence interval?
To figure this out, we randomly draw 100 observations 100 times from three distinct populations and plot the mean and corresponding 95% confidence interval of each sample.
(more…)
 Bootstrapping is a methodology derived by Bradley Efron in the 1980s that provides a reasonable approximation to the sampling distribution of various “difficult” statistics. Difficult statistics are those where there is no mathematical theory to establish a distribution.
(more…)
Most of the time when we plan a sample size for a data set, it’s based on obtaining reasonable statistical power for a key analysis of that data set. These power calculations figure out how big a sample you need so that a certain width of a confidence interval or p-value will coincide with a scientifically meaningful effect size.
But that’s not the only issue in sample size, and not every statistical analysis uses p-values.
(more…)
 There’s a common saying among pediatricians: children are not little adults. You can’t take a drug therapy that works in adults and scale it down to a kid-sized treatment.