If you’ve tried coding in Stata, you may have found it strange. The syntax rules are straightforward, but different from what I’d expect.
I had experience coding in Java and R before I ever used Stata. Because of this, I expected commands to be followed by parentheses, and for this to make it easy to read the code’s structure.
Stata does not work this way.
An Example of how Stata Code Works
To see the way Stata handles a linear regression, go to the command line and type
h reg or help regress
You will see a help page pop up, with this Syntax line near the top.
(If you need a refresher on getting help in Stata, watch this video by Jeff Meyer.)

This is typical of how Stata code looks. (more…)
From our first Getting Started with Stata posts, you should be comfortable navigating the windows and menus of Stata. We can now get into programming in Stata with a do-file.
Why Do-Files?
A do-file is a Stata file that provides a list of commands to run. You can run an entire do-file at once, or you can highlight and run particular lines from the file.
If you set up your do-file correctly, you can just click “run” after opening it. The do-file will set you to the correct directory, open your dataset, do all analyses, and save any graphs or results you want saved.
I’ll start off by saying this: Any analysis you want to run in Stata can be run without a do-file, just using menus and individual commands in the command window. But you still should make a do-file for the following reason:
Reproducibility (more…)
 Regression is one of the most common analyses in statistics. Most of us learn it in grad school, and we learned it in a specific software. Maybe SPSS, maybe another software package. The thing is, depending on your training and when you did it, there is SO MUCH to know about doing a regression analysis in SPSS.
(more…)
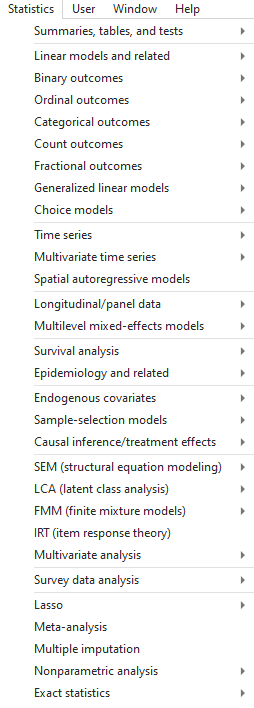
In part 3 of this series, we explored the Stata graphics menu. In this post, let’s look at the Stata Statistics menu.
Statistics Menu

Let’s use the Statistics menu to see if price varies by car origin (foreign).
We are testing whether a continuous variable has a different mean for the two categories of a categorical variable. So we should do a 2-sample t-test.
Say we want to use a 90% confidence level, and we have reason to suspect the two groups have unequal variance.
Click Statistics -> Summaries, tables, and tests -> Classical tests of hypothesis -> t test (mean-comparison test).
We want a Two-sample using groups. Put “price: for Variable name and “foreign” for Group variable name.
We click the Unequal variances button in the Main tab to make the variances of the two groups distinct, then change the Confidence level to 90%, and press OK.
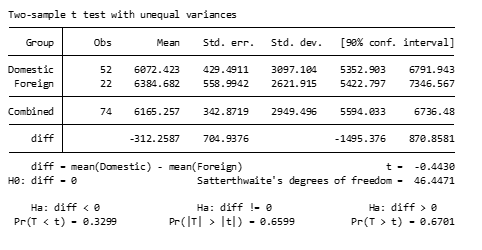
Stata outputs the following code:
ttest price, by(foreign) unequal level(90)
and the following table:

This statistics tab can be used for all sorts of tests and analysis, such as regressions, generalized linear models, variable summaries, z-tests, and much more. Go ahead and look through the menu to get an idea of what’s available.
But now that you know how to use the menus, we’re not going to use them much in the rest of this series.
As a general rule, it is typically better to use do-files for our analysis, and only use the menus for helping to find the right code to put into our do-files.
by James Harrod
About the Author: James Harrod interned at The Analysis Factor in the summer of 2023. He plans to continue into a career as an actuary, and hopes to continue finding interesting ways of educating people about statistics. James is well-versed in R and Stata programming and enjoys teaching the intuition behind common statistical methods. James is a 2023 graduate of the University of Rochester with bachelor’s degrees in Statistics and Economics.
If you have run mixed models much at all, you have undoubtedly been haunted by some version of this very obtuse warning: “The  Hessian (or G or D) Matrix is not positive definite. Convergence has stopped.”
Or “The Model has not Converged. Parameter Estimates from the last iteration are displayed.”
What on earth does that mean?
Let’s start with some background. If you’ve never taken matrix algebra, (more…)
One issue in data analysis that feels like it should be obvious, but often isn’t, is setting up your data.
The kinds of issues involved include:
- What is a variable?

- What is a unit of observation?
- Which data should go in each row of the data matrix?
Answering these practical questions is one of those skills that comes with experience, especially in complicated data sets.
Even so, it’s extremely important. If the data isn’t set up right, the software won’t be able to run any of your analyses.
And in many data situations, you will need to set up the data different ways for different parts of the analyses. (more…)


