When interpreting the results of a linear regression model, the first step is to look at the regression coefficients. Each term in the model has one. And each one describes the average difference in the value of Y for a one-unit difference in the value of the predictor variable, X, that makes up that term.
It’s the effect size statistic for that term in the model.
A second step is to look at marginal means. These marginal means have different names in different books and software. You may have seen them called:
- LSMeans
- Estimated Marginal Means
- Predicted Means
- Predicted Values
- Model-based means
- Conditional means
Whatever they’re called, they are pretty simple in concept: they are the value of Y predicted by the model, at specific values of each X.
An example in linear regression: coefficients and marginal means
A great strategy for understanding the effects of predictors is to choose 2-5 values of a specific X, and look at the marginal means at those specific values of X.
For example, in a model that regresses birth weight in pounds(Y) on gestational age of the infant at birth in weeks (X), along with a number of covariates, the regression coefficient is .28. That indicates that each additional week predicts an average increase in the weight of the infant of just over a quarter of a pound, after accounting for the effects of covariates.
That is useful and a great summary of the relationship between gestational age and birthweight.
But we can get a richer understanding by looking at the marginal means of birthweight for four gestational ages (the due date is 40 weeks), holding all other covariates at their means:
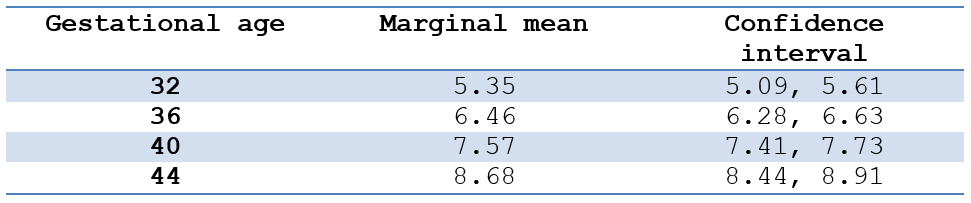
These marginal means help give a context to the difference in means as X increases, as described by the coefficient.
An example in logistic regression: odds ratios and predicted odds
We can take the same strategy in logistic regression for a binary outcome variable. This time our outcome variable is whether or not the mother had a cesarean birth.
Because the coefficients are reported on a log-odds scale, we use the odds ratio as a summary description of the relationship between gestational age and the odds of a cesarean birth, after adjusting for other covariates.
This odds ratio is .90. This means for each additional week of gestation, the odds of a cesarean decrease by 10%.
But again, without knowing what the odds of cesarean are, that’s hard to evaluate. A 10% increased odds for a very rare outcome is still very rare. Looking at predicted values helps us understand that increase in context.
Most software makes it easy to directly output the predicted probabilities or the predicted log-odds, but not the predicted odds. I have generally found that most audiences find probabilities easier to understand.
But there isn’t a direct relationship between X’s effect size, the odds ratio, and the predicted probabilities. So it’s worth taking the extra step to calculate that predicted odds.
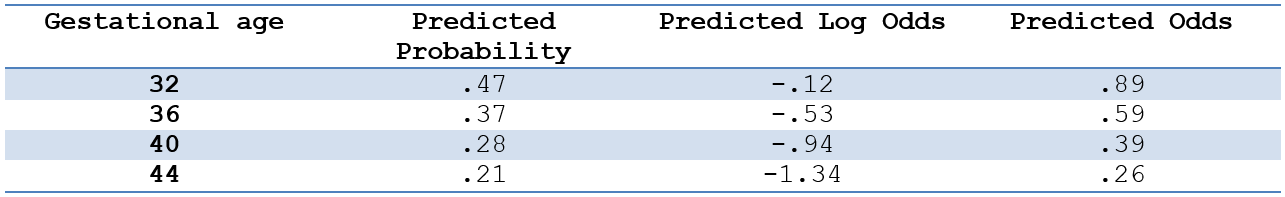
So even if you eventually present the predicted probabilities in your paper, taking the intermediate step of manually calculating predicted odds can help you understand the model results.
The formula is easy: odds = P/(1-P).
In linear regression, you can think of the regression coefficient as the difference between two marginal means when you’ve chosen values of X that are one unit apart.
Likewise, in logistic regression, you can think of the odds ratio as the ratio of two predicted odds when you’ve chosen values of X that are one unit apart.

Leave a Reply