 A well-fitting regression model results in predicted values close to the observed data values. The mean model, which uses the mean for every predicted value, generally would be used if there were no useful predictor variables. The fit of a proposed regression model should therefore be better than the fit of the mean model. But how do you measure that model fit?
F test
Beyond R-squared: Assessing the Fit of Regression Models
February 20th, 2024 by Karen Grace-MartinWhen the Results of Your ANOVA Table and Regression Coefficients Disagree
December 8th, 2022 by Karen Grace-MartinHave you ever had this happen? You run a regression model. It can be any kind—linear, logistic, multilevel, etc. In the ANOVA table, the effect of interest has a very low p-value. In the regression table, it doesn’t. Or vice-versa.
How can the same effect have two different p-values? In this article, let’s explore when this happens and what it means.
What the statistics in each table measures
The ANOVA table is a table of F tests. It may not be called the ANOVA table on your output, but it always includes a set of F tests. Some software procedures only give one F test for the model as a whole, but most will break it down into a series of F tests, one for each predictor variable or term in your model.
The regression coefficients table is a table of t tests. It includes each regression coefficient, along with its standard error, and usually a t test (some generalized linear models will have Wald or z tests instead, but they have the same role here).
Both tables often list out each predictor variable, along with a p-value for that variable’s conditional effect on Y.
There are two situations in which the p-values will match. Both must be true.
- The F test has one df. This happens in two situations. Either the predictor, X, is numerical or it’s categorical and binary (only two groups).
- The predictor is not involved with any interactions with a variable that is not centered at is mean.
If both of those are true, not only will the p-value match, but the t-statistic in the regression coefficients table will be the positive or negative square root of the F statistic.
An Example ANOVA Table with Matching and Unmatching Regression Coefficients
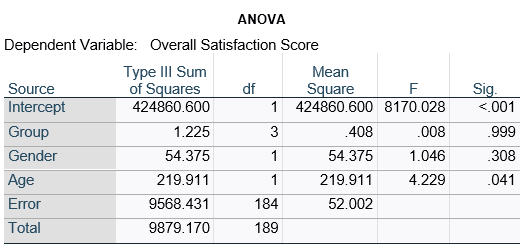
Here’s an example of an ANOVA table from a linear regression. In this example, there are four treatment groups, two genders, and age in years (measured continuously and centered at its mean). The response variable, Y, is a satisfaction score with a training. The four groups represented four learning strategies the adult learners were trained to use.
Let’s compare this to the regression coefficients table.
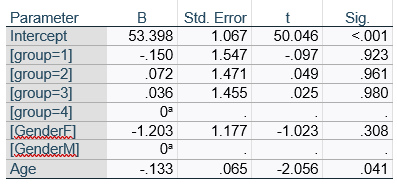
If you compare p-values across the two tables, you can see that Gender and Age have the same p-values, but Group doesn’t.
Gender and Age meet both conditions. Both have 1 df in the F table. Gender because it’s binary (two categories) and Age because it’s numerical). There are no interactions.
Group doesn’t match because it has 3 df in the F test. The F test is testing the null hypothesis that there is no difference among the four means. The t-tests in the regression coefficients table are testing three specific contrasts. Each one compares one group mean to the group 4 mean. For example, the group=1 coefficient tests whether the difference between the mean group 1 satisfaction score differs only from the group 4 score. It’s a different null hypothesis than the F test.
This would be the case whether or not there were interactions in the model that contain Group. Any time you have more that one df in the F test (you can see group has 3), you’ll get as many p-values in the regression coefficients as you have df in the F table. The p-values can’t match because there are more of them in the regression coefficients table.
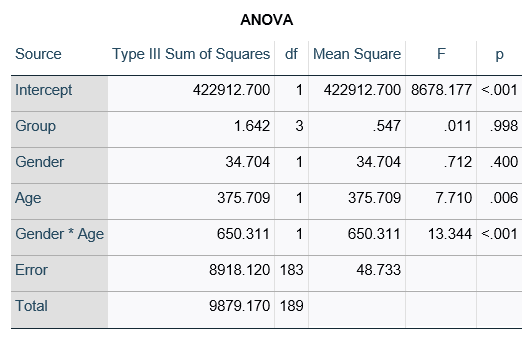
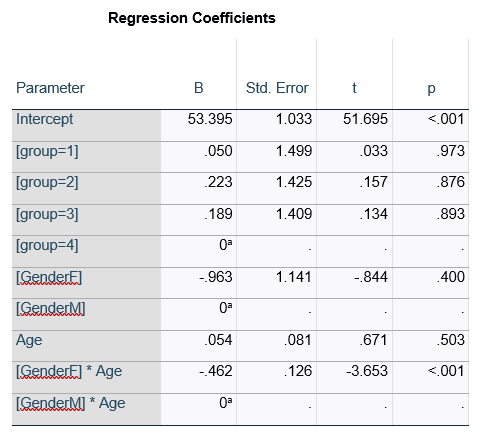
Gender, which is also categorical, does have the same p-value in both tables. It has 1 df in the F test, which tests the null hypothesis that the two gender means have no variance (they’re the same). Gender is involved in an interaction, so the only reason the hypothesis test, and therefore the p-value, is the same is because the variable it interacts with, Age, is centered.
In conclusion, most of the time, it’s fine if the results don’t match. It’s because the two tables are reporting results of different hypothesis tests, based on what’s in your model.
Member Training: The Anatomy of an ANOVA Table
December 31st, 2019 by Jeff Meyer
Our analysis of linear regression focuses on parameter estimates, z-scores, p-values and confidence levels. Rarely in regression do we see a discussion of the estimates and F statistics given in the ANOVA table above the coefficients and p-values.
And yet, they tell you a lot about your model and your data. Understanding the parts of the table and what they tell you is important for anyone running any regression or ANOVA model.
Interpreting Interactions: When the F test and the Simple Effects disagree.
May 11th, 2009 by Karen Grace-MartinThe way to follow up on a significant two-way interaction between two categorical variables is to check the simple effects. Most of the time the simple effects tests give a very clear picture about the interaction. Every so often, however, you have a significant interaction, but no significant simple effects. It is not a logical impossibility. They are testing two different, but related hypotheses.
Assume your two independent variables are A and B. Each has two values: 1 and 2. The interaction is testing if A1 – B1 = A2 – B2 (the null hypothesis). The simple effects are testing whether A1-B1=0 and A2-B2=0 (null) or not.
If you have a crossover interaction, you can have A1-B1 slightly positive and A2-B2 slightly negative. While neither is significantly different from 0, they are significantly different from each other.
And it is highly useful for answering many research questions to know if the differences in the means in one condition equal the differences in the means for the other. It might be true that it’s not testing a hypothesis you’re interested in, but in many studies, all the interesting effects are in the interactions.
One-tailed and Two-tailed Tests
November 19th, 2008 by Karen Grace-MartinI was recently asked about when to use one and two tailed tests.
The long answer is: Use one tailed tests when you have a specific hypothesis about the direction of your relationship. Some examples include you hypothesize that one group mean is larger than the other; you hypothesize that the correlation is positive; you hypothesize that the proportion is below .5.
The short answer is: Never use one tailed tests.
Why?
1. Only a few statistical tests even can have one tail: z tests and t tests. So you’re severely limited. F tests, Chi-square tests, etc. can’t accommodate one-tailed tests because their distributions are not symmetric. Most statistical methods, such as regression and ANOVA, are based on these tests, so you will rarely have the chance to implement them.
2. Probably because they are rare, reviewers balk at one-tailed tests. They tend to assume that you are trying to artificially boost the power of your test. Theoretically, however, there is nothing wrong with them when the hypothesis and the statistical test are right for them.