
In Part 3 we used the lm() command to perform least squares regressions. In Part 4 we will look at more advanced aspects of regression models and see what R has to offer.
One way of checking for non-linearity in your data is to fit a polynomial model and check whether the polynomial model fits the data better than a linear model. However, you may also wish to fit a quadratic or higher model because you have reason to believe that the relationship between the variables is inherently polynomial in nature. Let’s see how to fit a quadratic model in R.
We will use a data set of counts of a variable that is decreasing over time. Cut and paste the following data into your R workspace.
A <- structure(list(Time = c(0, 1, 2, 4, 6, 8, 9, 10, 11, 12, 13,
14, 15, 16, 18, 19, 20, 21, 22, 24, 25, 26, 27, 28, 29, 30),
Counts = c(126.6, 101.8, 71.6, 101.6, 68.1, 62.9, 45.5, 41.9,
46.3, 34.1, 38.2, 41.7, 24.7, 41.5, 36.6, 19.6,
22.8, 29.6, 23.5, 15.3, 13.4, 26.8, 9.8, 18.8, 25.9, 19.3)), .Names = c("Time", "Counts"),
row.names = c(1L, 2L, 3L, 5L, 7L, 9L, 10L, 11L, 12L, 13L, 14L, 15L, 16L, 17L, 19L, 20L, 21L, 22L, 23L, 25L, 26L, 27L, 28L, 29L, 30L, 31L),
class = "data.frame")
Let’s attach the entire dataset so that we can refer to all variables directly by name.
attach(A)
names(A)
First, let’s set up a linear model, though really we should plot first and only then perform the regression.
linear.model <-lm(Counts ~ Time)
We now obtain detailed information on our regression through the summary() command.
summary(linear.model)
Call:
lm(formula = Counts ~ Time)

Residuals:
   Min     1Q Median     3Q     Max
-20.084 -9.875 -1.882   8.494 39.445

Coefficients:
           Estimate Std. Error t value Pr(>|t|)
(Intercept) 87.1550     6.0186 14.481 2.33e-13 ***
Time         -2.8247     0.3318 -8.513 1.03e-08 ***
---
Signif. codes: 0 ‘***’ 0.001 ‘**’ 0.01 ‘*’ 0.05 ‘.’ 0.1 ‘ ’ 1

Residual standard error: 15.16 on 24 degrees of freedom
Multiple R-squared: 0.7512,   Adjusted R-squared: 0.7408
F-statistic: 72.47 on 1 and 24 DF, p-value: 1.033e-08
The model explains over 74% of the variance and has highly significant coefficients for the intercept and the independent variable and also a highly significant overall model p-value. However, let’s plot the counts over time and superpose our linear model.
plot(Time, Counts, pch=16, ylab = "Counts ", cex.lab = 1.3, col = "red" )

abline(lm(Counts ~ Time), col = "blue")
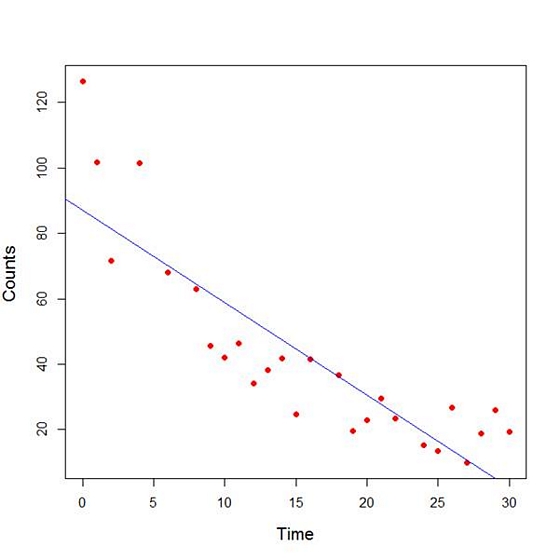
Here the syntax cex.lab = 1.3 produced axis labels of a nice size.
The model looks good, but we can see that the plot has curvature that is not explained well by a linear model. Now we fit a model that is quadratic in time. We create a variable called Time2 which is the square of the variable Time.
Time2 <- Time^2
quadratic.model <-lm(Counts ~ Time + Time2)
Note the syntax involved in fitting a linear model with two or more predictors. We include each predictor and put a plus sign between them.
summary(quadratic.model)
Call:
lm(formula = Counts ~ Time + Time2)
Residuals:
     Min       1Q   Median       3Q     Max
-24.2649 -4.9206 -0.9519   5.5860 18.7728

Coefficients:
             Estimate Std. Error t value Pr(>|t|)
(Intercept) 110.10749   5.48026 20.092 4.38e-16 ***
Time         -7.42253   0.80583 -9.211 3.52e-09 ***
Time2         0.15061   0.02545   5.917 4.95e-06 ***
---
Signif. codes: 0 ‘***’ 0.001 ‘**’ 0.01 ‘*’ 0.05 ‘.’ 0.1 ‘ ’ 1

Residual standard error: 9.754 on 23 degrees of freedom
Multiple R-squared: 0.9014,   Adjusted R-squared: 0.8928
F-statistic: 105.1 on 2 and 23 DF, p-value: 2.701e-12
Our quadratic model is essentially a linear model in two variables, one of which is the square of the other. We see that however good the linear model was, a quadratic model performs even better, explaining an additional 15% of the variance. Now let’s plot the quadratic model by setting up a grid of time values running from 0 to 30 seconds in increments of 0.1s.
timevalues <- seq(0, 30, 0.1)
predictedcounts <- predict(quadratic.model,list(Time=timevalues, Time2=timevalues^2))
plot(Time, Counts, pch=16, xlab = "Time (s)", ylab = "Counts", cex.lab = 1.3, col = "blue")
Now we include the quadratic model to the plot using the lines() command.
lines(timevalues, predictedcounts, col = "darkgreen", lwd = 3)
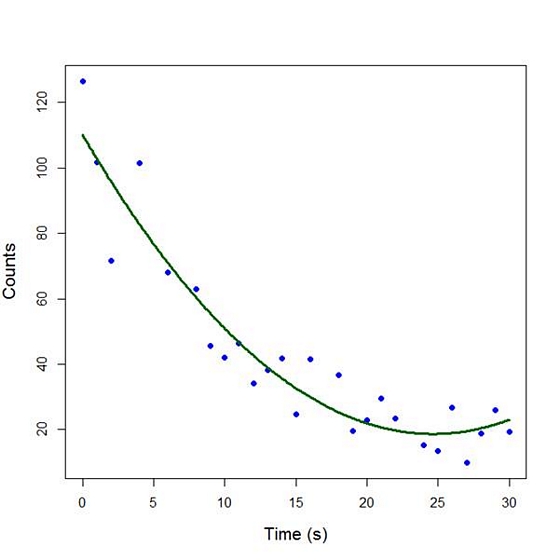
The quadratic model appears to fit the data better than the linear model. We will look again at fitting curved models in our next blog post.
About the Author: David Lillis has taught R to many researchers and statisticians. His company, Sigma Statistics and Research Limited, provides both on-line instruction and face-to-face workshops on R, and coding services in R. David holds a doctorate in applied statistics.
See our full R Tutorial Series and other blog posts regarding R programming.
It’s a bit difficult to find in references how to work a function predict with a list in parameters. There is a line in the post like predict(quadratic.model, list(Time=timevalues, Time2=timevalues^2)) the meaning of what is little unclear.
Dear David,
Much thanks for your tutorial.
A question about one of your examples though:
Time2 = Time^2
[quadratic.model <-lm(Counts ~ Time + Time2)]
Some resources seem to suggest to orthogonalize such a model, eg:
[quadratic.model <-lm(Counts ~ poly(Time,2))]
The difference being that the first example would violate the assumption of multicollinearity.
Your insights are much appreciated. Thank you.
Best wishes,
Rens
if i estimate a qudratic model (Y on X). I can estimate the derivative of Y wrt to X as b1+2*b2*X. Now i can compute where the marginal effect is maximized by setting that equal to zero, or X* = -b1/2*b2.
Since b1 and b2 are estimated, R can give me a p-value for the nonlinear combination. However, i’m not sure how to interpret it when signif versus not.
Help?
Hi Todd,
It’s not clear to me what hypothesis you’re trying to test or what exactly you’re trying to interpret. Is it whether X has an effect on Y in general? Whether the curvature is significant and therefore testing whether the effect of X on Y is quadratic vs. linear?
How would I tackle a quadratic model if my x variables consist of dates in POSIXct. I am unable to square the values in this form, but can when I switch them to numeric. I prefer to keep them as dates in POSIXct if possible.
I assume you could try the julian date (function “yday()”)
Do you know how to estimate the minimum value predicted for the quadratic model? And to estimate the precise value of time that would predict that minimum?
Thank you
Regards
Y=structure(list(Distant = c(253,337,395,451,495,534,574),
Height = c(100,200,300,450,600,800,1000)). How can a problem be run in R using cubic and quadratic model.
The quadratic fit works but the problem is that the fit overlaps/extend beyond the data points until it touches the x-axis line (on both ends of the fit). And my data points are somewhere in the middle of the plot. How do I just confine the curve fit to the area where there are data points?
May I just say what a comfort to find someone who truly understands what they’re
talking about on the internet. You definitely know
how to bring a problem to light and make it important.
A lot more people should look at this and understand this side of the story.
I was surprised that you’re not more popular because you definitely have the gift.
Thank you very much.. Hit your site, exactly when needed.
Was sitting with a dataset that is not linear and the results were not interesting at all.
Many Thanks.
Dear Karen,
I just visited this interesting website, and wonder if you could help me with an error message I am receiving when I try to run a network meta-regression model in R studio. The error says: Regressor variable “hiv” not found. Thank you in advance for your time. Please let me know if you want me to send you the dataset and the code.
All the best.
Floriano
For beginners who just got started with learning Data Science, languages such as R can be a little confusing but step by step tutorials such as these make the learning experience much better and easier. Thanks for sharing this great knowledge!
Hello.
You are quite correct. In this context, the word ‘linear” refers to the estimated parameters, and therefore models with quadratic or higher order polynomial variables are in fact linear.
Applied statisticians and researchers trained in the natural and social sciences (rather than in statistics) often use the terms ‘quadratic model’, ‘exponential model’ etc in the context of regression somewhat loosely (i.e. referring to linearity or higher order functions of the prefictors rather than in the estimated parameters). Various texts (e.g. Statistics: an Introduction using R, by Michael Crawley) and other works available on-line often refer to such models this way.
In writing Blogs such as this one, I attempt to make the examples understandable to a wide variety of people, including those relatively new to statistical modelling and those new to R. I find it convenient to refer to such regression models as “quadratic models”, “exponential models” etc. I believe that this approach makes the learning process easier for those new to statistical modelling because those descriptors reflect the statistical models we are attempting to fit.
The challenge for those new to R is to master the syntax and the various commands that are available in R, but very often I encounter people who are both new to R and who are learning statistics at the same time. Assisting them to achieve competence in R syntax is the objective of my blogs and workshops. For them clarity and simplicity are paramount.
Thank you for your comment. Your point is well made and in future blogs and workshops in which I present material similar to that given in this blog, I will explain that when I refer to linear and quadratic models etc I am referring to the predictors.
Best wishes,
David
Regression models with polynomial variables are linear models. The “linear” in linear model refers to the parameters, not the variables. Models with quadratic, cubic, quartic, or higher order polynomial variables are therefore linear. The post seems a little misleading on this point.