Not too long ago, a client asked for help with using Spotlight Analysis to interpret an interaction in a regression model.
Spotlight Analysis? I had never heard of it.
As it turns out, it’s a (snazzy) new name for an old way of interpreting an interaction between a continuous and a categorical grouping variable in a regression model.
This kind of interaction indicates that the slopes of the best-fitting regression lines between the continuous predictor and the outcome are not parallel for every group.
So the easiest way to interpret this is to examine the difference in those slopes.
Here is a simple example.
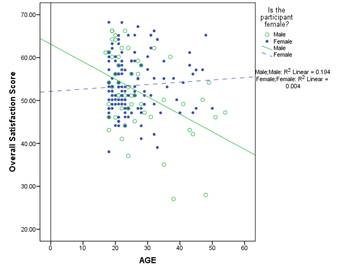 In this graph, we see a significant interaction between Age, a continuous predictor, and experimental group, a categorical predictor. The blue dashed line represents the effect of age on satisfaction score for the control group. The green solid line represents the effect of age on satisfaction score for the experimental group.
The simplest interpretation is that the effect of Age is not the same for people in the control and the intervention group.
Simple and valid though this interpretation may be, it may not get to the heart of your research question.
And that’s what results should do—answer your research question.
Most of the time researchers have experimental and control groups, that comparison is primary. The effect of Age may be interesting, and it may be important to consider. But if your research question is about the difference between the groups, not the effect of Age, you’ll want to interpret the results in those terms.
A better way to communicate what is really going on is to describe the interaction in terms of the effect of Condition at specific ages.
This is called spotlight analysis.
The basic idea of spotlight analysis is to compare the mean satisfaction score of the two groups at specific values of the continuous covariate.
In other words, you shine a spotlight on two or three specific ages and test the group differences at each one. This gives you a test, with a p-value, for the difference in mean satisfaction score at three different ages. The interaction already told us that these mean differences aren’t the same
There are two ways to do this.
The simpler is to compare the Age-adjusted means using some sort of multiple comparison procedure. This is very easy to do in most general linear model procedures using marginal means.
SPSS calls them Estimated Marginal Means (EMMeans) and SAS calls them Least Squares Means (LSMeans), but they’re the same thing. They’re not the same straight means that you get from Descriptives. They’re the mean of Y for each group at one specified value of a covariate—exactly what you want here.
For example, in SPSS, to compare the mean satisfaction across groups at Age 40, use the EMMeans subcommand using a WITH(Age=40) option. The EMMeans subcommand can be used in many commands, including UNIANOVA and Mixed.
The ability to specify a specific value of age (other than the mean, which is the default) is only available in syntax, not the menus.
In both procedures, you will be able to not only get estimates of these marginal means, but run a post-hoc test to compare them.
The more complex, but equivalent, approach is to rescale Age so that the regression coefficients give you just the comparison you’re looking for. It’s really the same process as centering Age at specific values, so that the coefficients reflect the comparisons you want. The steps to this more complex approach are available in Spiller, Fitzsimmons, Lynch, and McClelland (2012).
Further Reading and Resources
Spiller, Fitzsimmons, Lynch, and McClelland (2012). Spotlights, Floodlights, and the Magic Number Zero: Simple Effects Tests in Moderated Regression, Journal of Marketing Research.

Dear Karen,
Thank you for all the wonderful advice on these pages. I just wanted to ask if there is a statistical technique (that can be performed in SPSS) similar to spotlight analysis, where the output would return at which levels of the covariate the difference between groups becomes significant? For example, in data used above it may tell you that the slopes are different below 10 years of age or above 40.
I suspect you could just slowly change the level at which you calculate the estimated marginal mean manually, until you find/lose significance but this seems imprecise.
Hi Philip,
I don’t know of one. I think the only way to do it is to change the value of the covariate. Remember that “significance” is arbitrary. It’s not a real situation, just an accepted cut off of a continuous value (the p-value).