Previous Posts
Open data, particularly government open data is a rich source of information that can be helpful to researchers in almost every field, but what is open data? How do we find what we’re looking for? What are some of the challenges with using data directly from city, county, state, and federal government agencies?
There are many statistical concepts that are easy to confuse. Sometimes the problem is the terminology. We have a whole series of articles on Confusing Statistical Terms. But in these cases, it’s the concepts themselves. Similar, but distinct concepts that are easy to confuse. Some of these are quite high-level, and others are fundamental. For […]
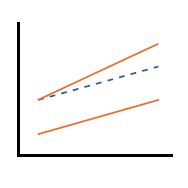
When you’re model building, a key decision is which interaction terms to include. And which interactions to remove. As a general rule, the default in regression is to leave them out. Add interactions only with a solid reason. It would seem like data fishing to simply add in all possible interactions. And yet, that’s a […]
Statistical inference using hypothesis testing is ubiquitous in science. Several misconceptions and misinterpretations of p-values have arisen over the years, which can lead to challenges communicating the correct interpretation of results.
Most of the time when we plan a sample size for a data set, it’s based on obtaining reasonable statistical power for a key analysis of that data set. These power calculations figure out how big a sample you need so that a certain width of a confidence interval or p-value will coincide with a […]
Lest you believe that odds ratios are merely the domain of logistic regression, I’m here to tell you it’s not true. One of the simplest ways to calculate an odds ratio is from a cross tabulation table. We usually analyze these tables with a categorical statistical test. There are a few options, depending on the […]
Interpreting the results of logistic regression can be tricky, even for people who are familiar with performing different kinds of statistical analyses. How do we then share these results with non-researchers in a way that makes sense?
Whenever you use a multi-item scale to measure a construct, a key step is to create a score for each subject in the data set. This score is an estimate of the value of the latent construct (factor) the scale is measuring for each subject. In fact, calculating this score is the final step of […]
Ever hear this rule of thumb: “The Chi-Square test is invalid if we have fewer than 5 observations in a cell”. I frequently hear this mis-understood and incorrect “rule.” We all want rules of thumb even though we know they can be wrong, misleading, or misinterpreted. Rules of Thumb are like Urban Myths or like […]
An extremely useful area of statistics is a set of models that use latent variables: variables whole values we can’t measure directly, but instead have to infer from others. These latent variables can be unknown groups, unknown numerical values, or unknown patterns in trajectories.


 stat skill-building compass