new blog post: Member Training: The Dark Side of Data Science

Previous Posts
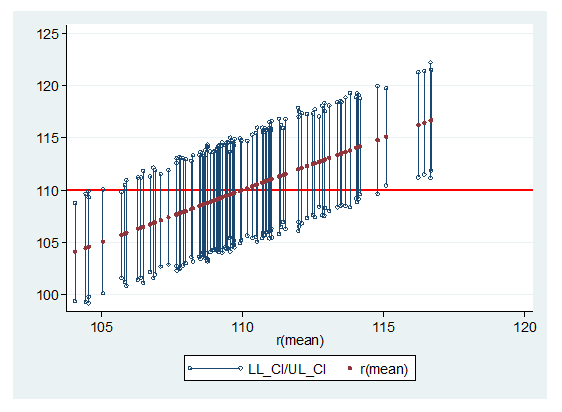
Any time you report estimates of parameters in a statistical analysis, it’s important to include their confidence intervals. How confident are you that you can explain what they mean? Even those of us who have a solid understand of confidence intervals get tripped up by the wording. The Wording for Describing Confidence Intervals Let’s look […]
Whether or not you run experiments, there are elements of experimental design that affect how you need to analyze many types of studies. The most fundamental of these are replication, randomization, and blocking. These key design elements come up in studies under all sorts of names: trials, replicates, multi-level nesting, repeated measures. Any data set […]
The following statement might surprise you, but it’s true. To run a linear model, you don’t need an outcome variable Y that’s normally distributed. Instead, you need a dependent variable that is: Continuous Unbounded Measured on an interval or ratio scale The normality assumption is about the errors in the model, which have the same […]
by Christos Giannoulis Many data sets contain well over a thousand variables. Such complexity, the speed of contemporary desktop computers, and the ease of use of statistical analysis packages can encourage ill-directed analysis. It is easy to generate a vast array of poor ‘results’ by throwing everything into your software and waiting to see what […]
Many of us love performing statistical analyses but hate writing them up in the Results section of the manuscript. We struggle with big-picture issues (What should I include? In what order?) as well as minutia (Do tables have to be double-spaced?).
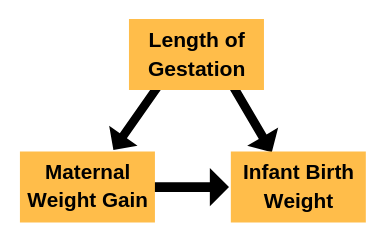
What is a Confounder? Confounder (also called confounding variable) is one of those statistical terms that confuses a lot of people. Not because it represents a confusing concept, but because of how it’s used. (Well, it’s a bit of a confusing concept, but that’s not the worst part). It has slightly different meanings to different […]
Predicting future outcomes, the next steps in a process, or the best choice(s) from an array of possibilities are all essential needs in many fields. The predictive model is used as a decision making tool in advertising and marketing, meteorology, economics, insurance, health care, engineering, and would probably be useful in your work too!
There are a number of simplistic methods available for tackling the problem of missing data. Unfortunately there is a very high likelihood that each of these simplistic methods introduces bias into our model results. Multiple imputation is considered to be the superior method of working with missing data. It eliminates the bias introduced by the […]
The concept of “hazard” is similar, but not exactly the same as, its meaning in everyday English. If you’re not familiar with Survival Analysis, it’s a set of statistical methods for modelling the time until an event occurs.Let’s use an example you’re probably familiar with — the time until a PhD candidate completes their dissertation.
One issue with using tests of significance is that black and white cut-off points such as 5 percent or 1 percent may be difficult to justify. Significance tests on their own do not provide much light about the nature or magnitude of any effect to which they apply. One way of shedding more light on […]
 stat skill-building compass