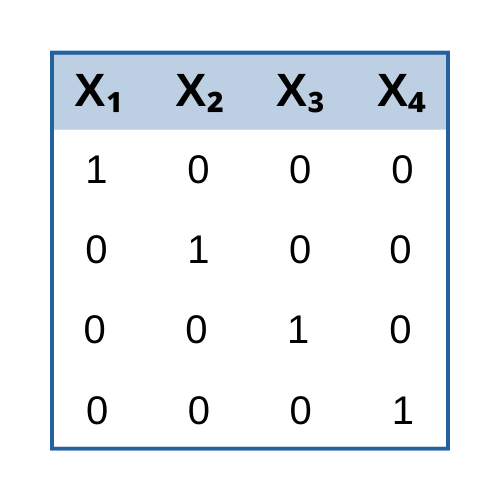
new blog post: Member Training: Dummy and Effect Coding
Previous Posts
Lately, I've gotten a lot of questions about learning how to run models for repeated measures data that isn't continuous. Mostly categorical. But once in a while discrete counts. A typical study is in linguistics or psychology where..
A Science News article from July 2014 was titled “Scientists’ grasp of confidence intervals doesn’t inspire confidence.” Perhaps that is why only 11% of the articles in the 10 leading psychology journals in 2006 reported confidence intervals in their statistical analysis. How important is it to be able to create and interpret confidence intervals?
If you’ve ever worked on a large data analysis project, you know that just keeping track of everything is a battle in itself. Every data analysis project is unique, but here are a few strategies I used in a recent project that you may find helpful. They didn’t make the project easy, but they helped keep it from spiraling into overwhelm...
Just last week, a colleague mentioned that while he does a lot of study design these days, he no longer does much data analysis. His main reason was that 80% of the work in data analysis is preparing the data for analysis. Data preparation is s-l-o-w and he found that few colleagues and clients understood this...
In this webinar, we’ll discuss the different model options for count data, including how to figure out which one works best. We’ll go into detail about how the models are set up, some key statistics, and how to interpret parameter estimates.
I have recently worked with two clients who were running generalized linear mixed models in SPSS. Both had repeated measures experiments with a binary outcome. The details of the designs were quite different, of course. But both had pretty complicated combinations of within-subjects factors...
These types of errors are not associated with sample-to-sample variability but to sources like selection biases, frame coverage issues, and measurement errors. These are not the kind of errors you want in your survey.
As it is in history, literature, criminology and many other areas, context is important in statistics. Knowing from where your data comes gives clues about what you can do with that data and what inferences you can make from it. In survey samples context is critical because it informs you about how the sample was selected and from what population it was selected...
What do you do when you hear the word error? Do you think you made a mistake? Well in survey statistics, error could imply that things are as they should be. That might be the best news yet--error could mean that things are as they should be. Let's break this down a bit more before you think this might be a typo or even worse, an error...
Do you remember all those probability rules you learned (or didn’t) in intro stats? You know, things like the P(A|B)?While you may have thought that these rules were only about balls and urns (who pulls balls from urns anyway?), it’s actually not true. It turns out that having a good understanding of these rules (as well as actually remembering them) does come in handy when you’re doing data analysis.
 stat skill-building compass