new blog post: Member Training: Dummy and Effect Coding
Previous Posts
If you have significant a significant interaction effect and non-significant main effects, would you interpret the interaction effect? It's a question I get pretty often, and it's a more straightforward answer than most. There is really only one situation possible in which an interaction is significant, but the main effects are not: a cross-over interaction.
In the last lesson we saw how to use qplot to map symbol colour to a categorical variable. Now we see how to control symbol colours and create legend titles..
In this lesson, let’s see how to use qplot to map symbol colour to a categorical variable. .
The qplot (quick plot) system is a subset of the ggplot2 (grammar of graphics) package which you can use to create nice graphs. It is great for creating graphs of categorical data, because you can map symbol colour, size and shape to the levels of your categorical variable. To use qplot first install ggplot2 as follows..
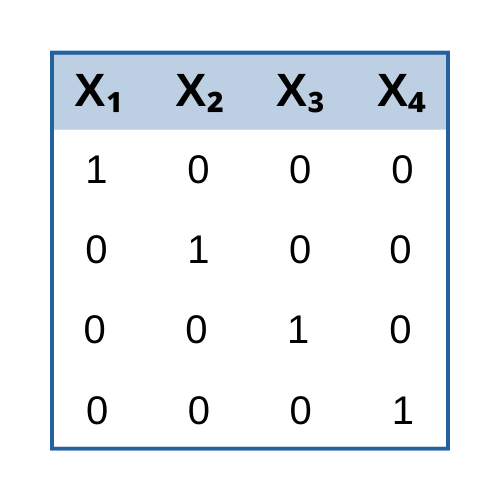
Data analysts can get away without ever understanding matrix algebra, certainly. But there are times when having even a basic understanding of how matrix algebra works and what it has to do with data can really make your analyses make a little more sense.
In Part 20, let’s see how to create mathematical expressions for your graph. Mathematical expressions on graphs are made possible through expression(paste()) and substitute()...
Today we see how to set up multiple graphs on the same page. We use the syntax par(mfrow=(A,B))..
Time Series are economic or other data that are collected over an extended period of time. Many clever methods have been developed to analyze time series, both to understand the factors that cause variation and to forecast future values.
One of those “rules” about statistics you often hear is that you can’t interpret a main effect in the presence of an interaction. Stats professors seem particularly good at drilling this into students’ brains. Unfortunately, it’s not true. At least not always.
You may have heard of McNemar tests as a repeated measures version of a chi-square test of independence. This is basically true, and I wanted to show you how these two tests differ and what exactly, each one is testing.
 stat skill-building compass