It’s easy to think that if you just knew statistics better, data analysis wouldn’t be so hard.

It’s true that more statistical knowledge is always helpful. But I’ve found that statistical knowledge is only part of the story.
Another key part is developing data analysis skills. These skills apply to all analyses. It doesn’t matter which statistical method or software you’re using. So even if you never need any statistical analysis harder than a t-test, developing these skills will make your job easier.
(more…)
My poor colleague was pulling her hair out in frustration today.
You know when you’re trying to do something quickly, and it’s supposed to be easy, only it’s not? And you try every solution you can think of and it still doesn’t work?
And even in the great age of the Internet, which is supposed to know all the things you don’t, you still can’t find the answer anywhere?
Cue hair-pulling.
Here’s what happened: She was trying to import an Excel spreadsheet into SAS, and it didn’t work.
Instead she got:
(more…)
Every statistical model and hypothesis test has assumptions.
And yes, if you’re going to use a statistical test, you need to check whether those assumptions are reasonable to whatever extent you can.
Some assumptions are easier to check than others. Some are so obviously reasonable that you don’t need to do much to check them most of the time. And some have no good way of being checked directly, so you have to use situational clues.
(more…)
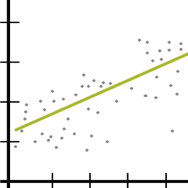
One of the most common—and one of the trickiest—challenges in data analysis is deciding how to include multiple predictors in a model, especially when they’re related to each other.

Let’s say you are interested in studying the relationship between work spillover into personal time as a predictor of job burnout.
You have 5 categorical yes/no variables that indicate whether a particular symptom of work spillover is present (see below).
While you could use each individual variable, you’re not really interested if one in particular is related to the outcome. Perhaps it’s not really each symptom that’s important, but the idea that spillover is happening.
(more…)
Like the chicken and the egg, there’s a question about which comes first: run a model or check assumptions? Unlike the chicken’s, the model’s question has an easy answer.
There are two types of model assumptions in a statistical model. Some are distributional assumptions about the errors. Examples include independence, normality, and constant variance in a linear model.
 Others are about the form of the model. They include linearity and (more…)
Not too long ago, a colleague mentioned that while he does a lot of study design these days, he no longer does much data analysis.
His main reason was that 80% of the work in data analysis is preparing the data for analysis. Data preparation is s-l-o-w and he found that few colleagues and clients understood this.
Consequently, he was running into expectations that he should analyze a raw data set in an hour or so.
You know, by clicking a few buttons.
I see this as well with researchers new to data analysis. While they know it will take longer than an hour, they still have unrealistic expectations about how long it takes.
So I am here to tell you, the time-consuming part is preparing the data. Weeks is a realistic time frame. Hours is not.
(Feel free to send this to your colleagues who want instant results.)
There are three parts to preparing data: cleaning it, creating necessary variables, and formatting all variables.
Data Cleaning
Data cleaning means finding and eliminating errors in the data. How you approach it depends on how large the data set is, but the kinds of things you’re looking for are:
- Impossible or otherwise incorrect values for specific variables
- Cases in the data who met exclusion criteria and shouldn’t be in the study
- Duplicate cases
- Missing data and outliers (don’t delete all outliers, but you may need to investigate to see if one is an error)
- Skip-pattern or logic breakdowns
- Making sure that the same value of string variables is always written the same way (male ≠ Male in most statistical software).
You can’t avoid data cleaning and it always takes a while, but there are ways to make it more efficient. For example, rather than search through the data set for impossible values, print a table of data values outside a normal range, along with subject ids.
This is where learning how to code in your statistical software of choice really helps. You’ll need to subset your data using IF statements to find those impossible values.
But if your data set is anything but small, you can also save yourself a lot of time, code, and errors by incorporating efficiencies like loops and macros so that you can perform some of these checks on many variables at once.
Creating New Variables
Once the data are free of errors, you need to set up the variables that will directly answer your research questions.
It’s a rare data set in which every variable you need is measured directly.
So you may need to do a lot of recoding and computing of variables.
Examples include:
And of course, part of creating each new variable is double-checking that it worked correctly.
Formatting Variables
Both original and newly created variables need to be formatted correctly for two reasons:
First, so your software works with them correctly. Failing to format a missing value code or a dummy variable correctly will have major consequences for your data analysis.
Second, it’s much faster to run the analyses and interpret results if you don’t have to keep looking up which variable Q156 is.
Examples include:
- Setting all missing data codes so missing data are treated as such
- Formatting date variables as dates, numerical variables as numbers, etc.
- Labeling all variables and categorical values so you don’t have to keep looking them up.
All of these steps require a solid knowledge of how to manage data in your statistical software. Each one approaches them a little differently.
It’s also very important to keep track of and be able to easily redo all your steps. Always assume you’ll have to redo something. So use (or record) syntax, not only menus.