Survey questions are often structured without regard for ease of use within a statistical model.
Take for example a survey done by the Centers for Disease Control (CDC) regarding child births in the U.S. One of the variables in the data set is “interval since last pregnancy”. Here is a histogram of the results.
(more…)
A great tool to have in your statistical tool belt is logistic regression.
It comes in many varieties and many of us are familiar with the variety for binary outcomes.
But multinomial and ordinal varieties of logistic regression are also incredibly useful and worth knowing. Because not every categorical outcome variable has only two categories.
They can be tricky to decide between in practice, however. In some — but not all — situations you (more…)
Multicollinearity can affect any regression model with more than one predictor. It occurs when two or more predictor variables overlap so much in what they measure that their effects are indistinguishable.
When the model tries to estimate their unique effects, it goes wonky (yes, that’s a technical term).
So for example, you may be interested in understanding the separate effects of altitude and temperature on the growth of a certain species of mountain tree.
(more…)
At times it is necessary to convert a continuous predictor into a categorical predictor. For example, income per household is shown below.
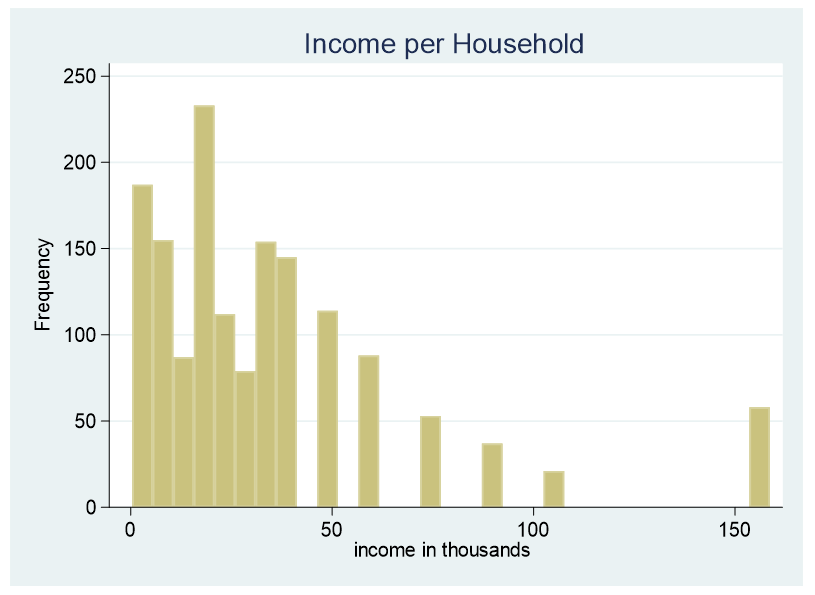
This data is censored, all family income above $155,000 is stated as $155,000. A further explanation about censored and truncated data can be found here. It would be incorrect to use this variable as a continuous predictor due to its censoring.
(more…)
What’s a good method for interpreting the results of a model with two continuous predictors and their interaction?
Let’s start by looking at a model without an interaction. In the model below, we regress a subject’s hip size on their weight and height. Height and weight are centered at their means.
(more…)
 Choosing statistical software is part of The Fundamentals of Statistical Skill and is necessary to learning a second software (something we recommend to anyone progressing from Stage 2 to Stage 3 and beyond).
You have many choices for software to analyze your data: R, SAS, SPSS, and Stata, among others. They are all quite good, but each has its own unique strengths and weaknesses.
(more…)