No matter what statistical model you’re running, you need to take the same steps. The order and the specifics of 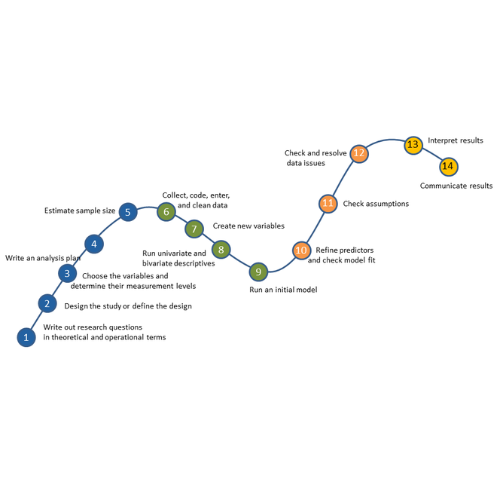 how you do each step will differ depending on the data and the type of model you use.
These steps are in 4 phases. Most people think of only the third as modeling. But the phases before this one are fundamental to making the modeling go well. It will be much, much easier, more accurate, and more efficient if you don’t skip them.
And there is no point in running the model if you skip the last phase. That’s where you communicate the results.
I’ve found that if I think of them all as part of the analysis, the modeling process is faster, easier, and makes more sense.
Phase 1: Define and Design
In the first five steps of running the model, the object is clarity. You want to make everything as clear as possible to yourself. The clearer things are at this point, the smoother everything will be. (more…)
If you’ve tried coding in Stata, you may have found it strange. The syntax rules are straightforward, but different from what I’d expect.
I had experience coding in Java and R before I ever used Stata. Because of this, I expected commands to be followed by parentheses, and for this to make it easy to read the code’s structure.
Stata does not work this way.
An Example of how Stata Code Works
To see the way Stata handles a linear regression, go to the command line and type
h reg or help regress
You will see a help page pop up, with this Syntax line near the top.
(If you need a refresher on getting help in Stata, watch this video by Jeff Meyer.)

This is typical of how Stata code looks. (more…)
Ever consider skipping the important step of cleaning your data? It’s tempting but not a good idea. Why? It’s a bit like baking.
I like to bake. There’s nothing nicer than a rainy Sunday with no plans, and a pantry full of supplies. I have done my shopping, and now it’s time to make the cake. Ah, but the kitchen is a mess. I don’t have things in order. This is no way to start.
First, I need to clear the counter, wash the breakfast dishes, and set out my tools. I need to take stock, read the recipe, and measure out my ingredients. Then it’s time for the fun part. I’ll admit, in my rush to get started I have at times skipped this step.
(more…)
There are many designs that could be considered Repeated Measures design, and they all have one key feature: you measure the outcome variable for each subject on several occasions, treatments, or locations.
Understanding this design is important for avoiding analysis mistakes. For example, you can’t treat multiple observations on the same subject as independent observations.
Example
Suppose that you recruit 10 subjects (more…)
From our first Getting Started with Stata posts, you should be comfortable navigating the windows and menus of Stata. We can now get into programming in Stata with a do-file.
Why Do-Files?
A do-file is a Stata file that provides a list of commands to run. You can run an entire do-file at once, or you can highlight and run particular lines from the file.
If you set up your do-file correctly, you can just click “run” after opening it. The do-file will set you to the correct directory, open your dataset, do all analyses, and save any graphs or results you want saved.
I’ll start off by saying this: Any analysis you want to run in Stata can be run without a do-file, just using menus and individual commands in the command window. But you still should make a do-file for the following reason:
Reproducibility (more…)
When you draw a graph- either a bar chart, a scatter plot, or even a pie chart, you have the choice of a broad range of colors that you can use. R, for example, has 657 different colors from aliceblue to yellowgreen. SAS has 13 shades of orange, 33 shades of blue, and 47 shades of green. They even have different shades of black.
You have a wealth of colors, but you can’t use all of them in the same graph. The ideal number of colors is 2.
(more…)