 In this lesson, we see how to use qplot to create a simple scatterplot.
The qplot (quick plot) system is a subset of the ggplot2 (grammar of graphics) package which you can use to create nice graphs. It is great for creating graphs of categorical data, because you can map symbol colour, size and shape to the levels of your categorical variable. To use qplot first install ggplot2 as follows:
(more…)
In this lesson, let’s see how to create mathematical expressions for your graph in R. We’ll use an example of graphing a cosine curve, along with relevant Greek letters as the axis label, and printing the equation right on the graph.
Mathematical expressions, like sine or exponential curves on graphs are made possible through expression(paste()) and substitute().
If you need mathematical symbols as axis labels, switch off the default axes and include Greek symbols by writing them out in English. You can create fractions through the frac() command. Note how we obtain the plus or minus sign through the syntax: %+-%
Here is a nice example. Let’s create a set of 71 values from – 6 to + 6. These values are the horizontal axis values.
x <- seq(-6, 6, len = 71)
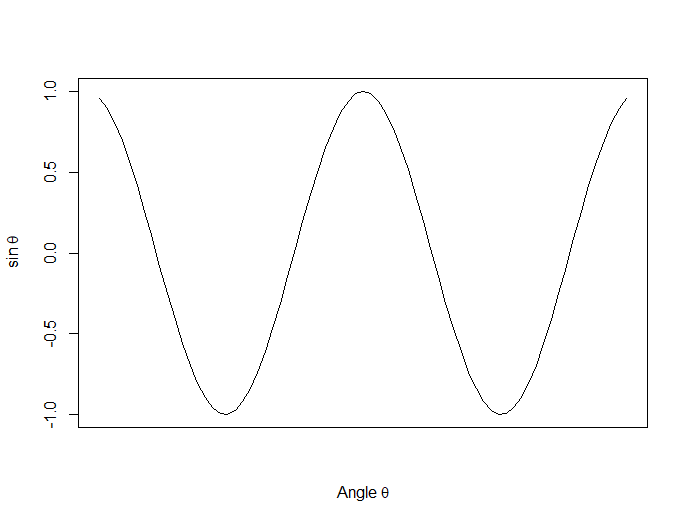
Now we plot a cosine function using a continuous curve (using type="l") while suppressing the x axis using the syntax: xaxt="n"
plot(x, cos(x),type="l",xaxt="n",

xlab=expression(paste("Angle ",theta)),

ylab=expression("sin "*theta))
. . . where we have inserted relevant mathematical text for the axis labels using expression(paste()). Here is the graph so far:
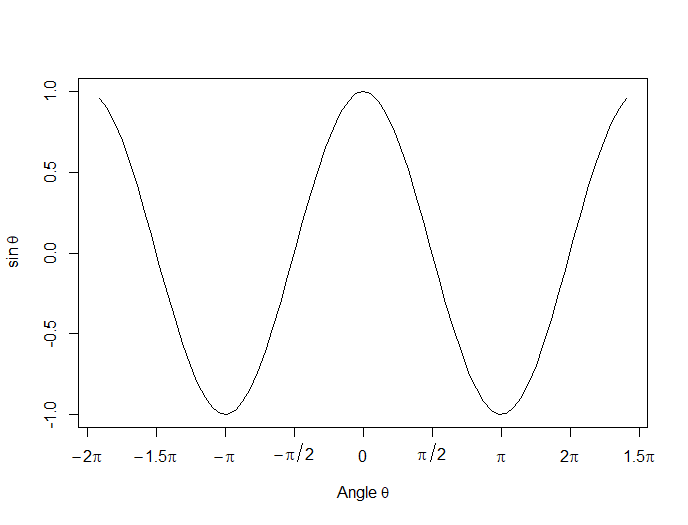
Now we create a horizontal axis to our own specifications, including relevant labels:
axis(1, at = c(-2*pi, -1.5*pi, -pi, -pi/2, 0, pi/2, pi, 1.5*pi, 2*pi),

lab = expression(-2*pi, -1.5*pi, -pi, -pi/2, 0, pi/2, pi, 2*pi, 1.5*pi))
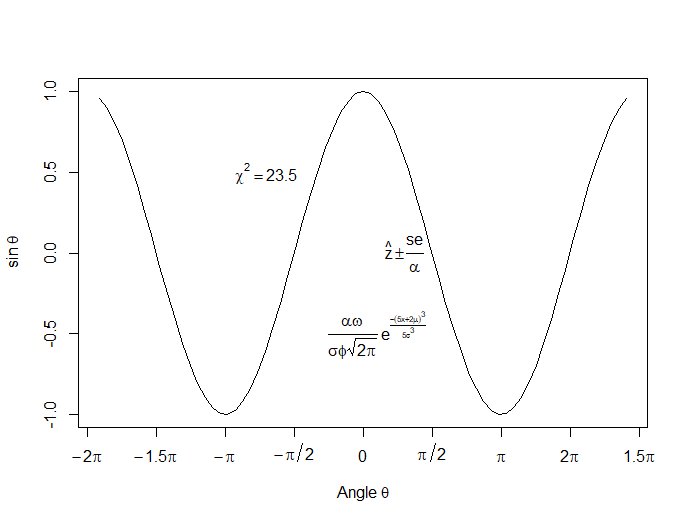
Let’s put in some mathematical expressions, centered appropriately. The first argument within each text() function gives the value along the horizontal axis about which the text will be centered.
text(-0.7*pi,0.5,substitute(chi^2=="23.5"))
text(0.1*pi, -0.5, expression(paste(frac(alpha*omega, sigma*phi*sqrt(2*pi)), ” “,
e^{frac(-(5*x+2*mu)^3, 5*sigma^3)})))
text(0.3*pi,0,expression(hat(z) %+-% frac(se, alpha)))
Here is our graph, complete with mathematical expressions:
That wasn’t so hard! In the next lesson we will discuss using qplot in R to create scatterplots.
About the Author: David Lillis has taught R to many researchers and statisticians. His company, Sigma Statistics and Research Limited, provides both on-line instruction and face-to-face workshops on R, and coding services in R. David holds a doctorate in applied statistics.
See our full R Tutorial Series and other blog posts regarding R programming.
Today we see how to set up multiple graphs on the same page. We use the syntax par(mfrow=(A,B)) (more…)
One of those “rules” about statistics you often hear is that you can’t interpret a main effect in the presence of an interaction.
Stats professors seem particularly good at drilling this into students’ brains.
Unfortunately, it’s not true.
At least not always. (more…)
You may have heard of McNemar tests as a repeated measures version of a chi-square test of independence. This is basically true, and I wanted to show you how these two tests differ and what exactly, each one is testing.
First of all, although Chi-Square tests can be used for larger tables, McNemar tests can only be used for a 2×2 table. So we’re going to restrict the comparison to 2×2 tables. (more…)
For my first assignment using Stata, I spent four or five hours trying to present my output in a “professional” form. The most creative method I heard about in class the next day was to copy the contents into Excel, create page breaks, and then copy into Word.
SPSS makes it so easy to copy tables and graphs into another document. Why can’t Stata be easy?
Anyone who has used Stata has gone through this and many of you still are. No worries, help is on the way! (more…)