by Steve Simon, PhD
There are two features of survival models.
First is the process of measuring the time in a sample of people, animals, or machines until a specific event occurs. In fact, many people use the term “time to event analysis” or “event history analysis” instead of “survival analysis” to emphasize the broad range of areas where you can apply these techniques.
Second is the recognition that not everyone/everything in your sample will experience the event. Those not experiencing the event, either because the study ended before they had the event or because they were lost to follow-up, are classified as censored observations.
(more…)
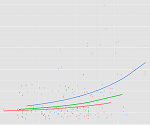
When you have data measuring the time to an event, you can examine the relationship between various predictor variables and the time to the event using a Cox proportional hazards model.

In this webinar, you will see what a hazard function is and describe the interpretations of increasing, decreasing, and constant hazard. Then you will examine the log rank test, a simple test closely tied to the Kaplan-Meier curve, and the Cox proportional hazards model.
Note: This training is an exclusive benefit to members of the Statistically Speaking Membership Program and part of the Stat’s Amore Trainings Series. Each Stat’s Amore Training is approximately 90 minutes long.
(more…)
Survival data models provide interpretation of data representing the time until an event occurs. In many situations, the event is death, but it can also represent the time to other bad events such as  cancer relapse or failure of a medical device. It can also be used to denote time to positive events such as pregnancy. Often patients are lost to follow-up prior to death, but you can still use the information about them while they were in your study to better estimate the survival probability over time.
This is done using the Kaplan-Meier curve, an approach developed by (more…)
What is the relationship between predictors and whether and when an event will occur?
This is what event history (a.k.a., survival) analysis tests.
There are many flavors of Event History Analysis, though, depending on how time is measured, whether events can repeat, etc.
In this webinar, we discussed many of the issues involved in measuring time, including censoring, and introduce one specific type of event history model: the logistic model for discrete time events.
Note: This training is an exclusive benefit to members of the Statistically Speaking Membership Program and part of the Stat’s Amore Trainings Series. Each Stat’s Amore Training is approximately 90 minutes long.
(more…)
Linear, Logistic, Tobit, Cox, Poisson, Zero Inflated… The list of regression models goes on and on before you even get to things like ANCOVA or Linear Mixed Models.
In this webinar, we will explore types of regression models, how they differ, how they’re the same, and most importantly, when to use each one.
Note: This training is an exclusive benefit to members of the Statistically Speaking Membership Program and part of the Stat’s Amore Trainings Series. Each Stat’s Amore Training is approximately 90 minutes long.
About the Instructor

Karen Grace-Martin helps statistics practitioners gain an intuitive understanding of how statistics is applied to real data in research studies.
She has guided and trained researchers through their statistical analysis for over 15 years as a statistical consultant at Cornell University and through The Analysis Factor. She has master’s degrees in both applied statistics and social psychology and is an expert in SPSS and SAS.
Not a Member Yet?
It’s never too early to set yourself up for successful analysis with support and training from expert statisticians.
Just head over and sign up for Statistically Speaking.
You'll get access to this training webinar, 130+ other stats trainings, a pathway to work through the trainings that you need — plus the expert guidance you need to build statistical skill with live Q&A sessions and an ask-a-mentor forum.
Need to dummy code in a Cox regression model?
Interpret interactions in a logistic regression?
Add a quadratic term to a multilevel model?
 This is where statistical analysis starts to feel really hard. You’re combining two difficult issues into one.
You’re dealing with both a complicated modeling technique at Stage 3 (survival analysis, logistic regression, multilevel modeling) and tricky effects in the model (dummy coding, interactions, and quadratic terms).
The only way to figure it all out in a situation like that is to break it down into parts. (more…)