 When you put a continuous predictor into a linear regression model, you assume it has a constant relationship with the dependent variable along the predictor’s range. But how can you be certain? What is the best way to measure this?
And most important, what should you do if it clearly isn’t the case?
Let’s explore a few options for capturing a non-linear relationship between X and Y within a linear regression (yes, really).
A Quadratic Term
Including a quadratic term will capture the change in the slope as you move from the bottom of X’s range to the top of the range. But a quadratic term only works in two situations:
- The rate of change increases and then at some point decreases, or:
- The opposite happens – the rate of change decreases and at some point increases.
Making a Continuous Predictor Categorical
You could also create a categorical variable. Each category within the categorical variable would represent a specific range within the continuous variable. However, the coefficients for the new categorical variable would no longer represent the expected change in the dependent variable per unit change in the predictor.
The coefficients would represent the mean change in the dependent variable as compared to the base category of the predictor.
Running Separate Models
You could also split your data set into subset data sets. Each new data set would consist of different ranges of your continuous predictor. But there are several issues that could arise from this. For example, the power of your analysis could be significantly diminished. Your ability to test for interactions might also be impacted. So this is not an approach that I would recommend using.
Segmented Regression
Better than running separate models is running a segmented (or piecewise) regression. A segmented regression allows you to generate different slopes for specific values of your continuous predictor. Instead of having several separate models, you have just one.
For example, let’s look at regressing income (in thousands of dollars) on years of education:

For every year of education, we expect income to increase by approximately $3,949. It doesn’t matter what level of education one has obtained. Put in an additional year of schooling and you’ll make an additional $3,949 per year.
Here’s the graph of this model:
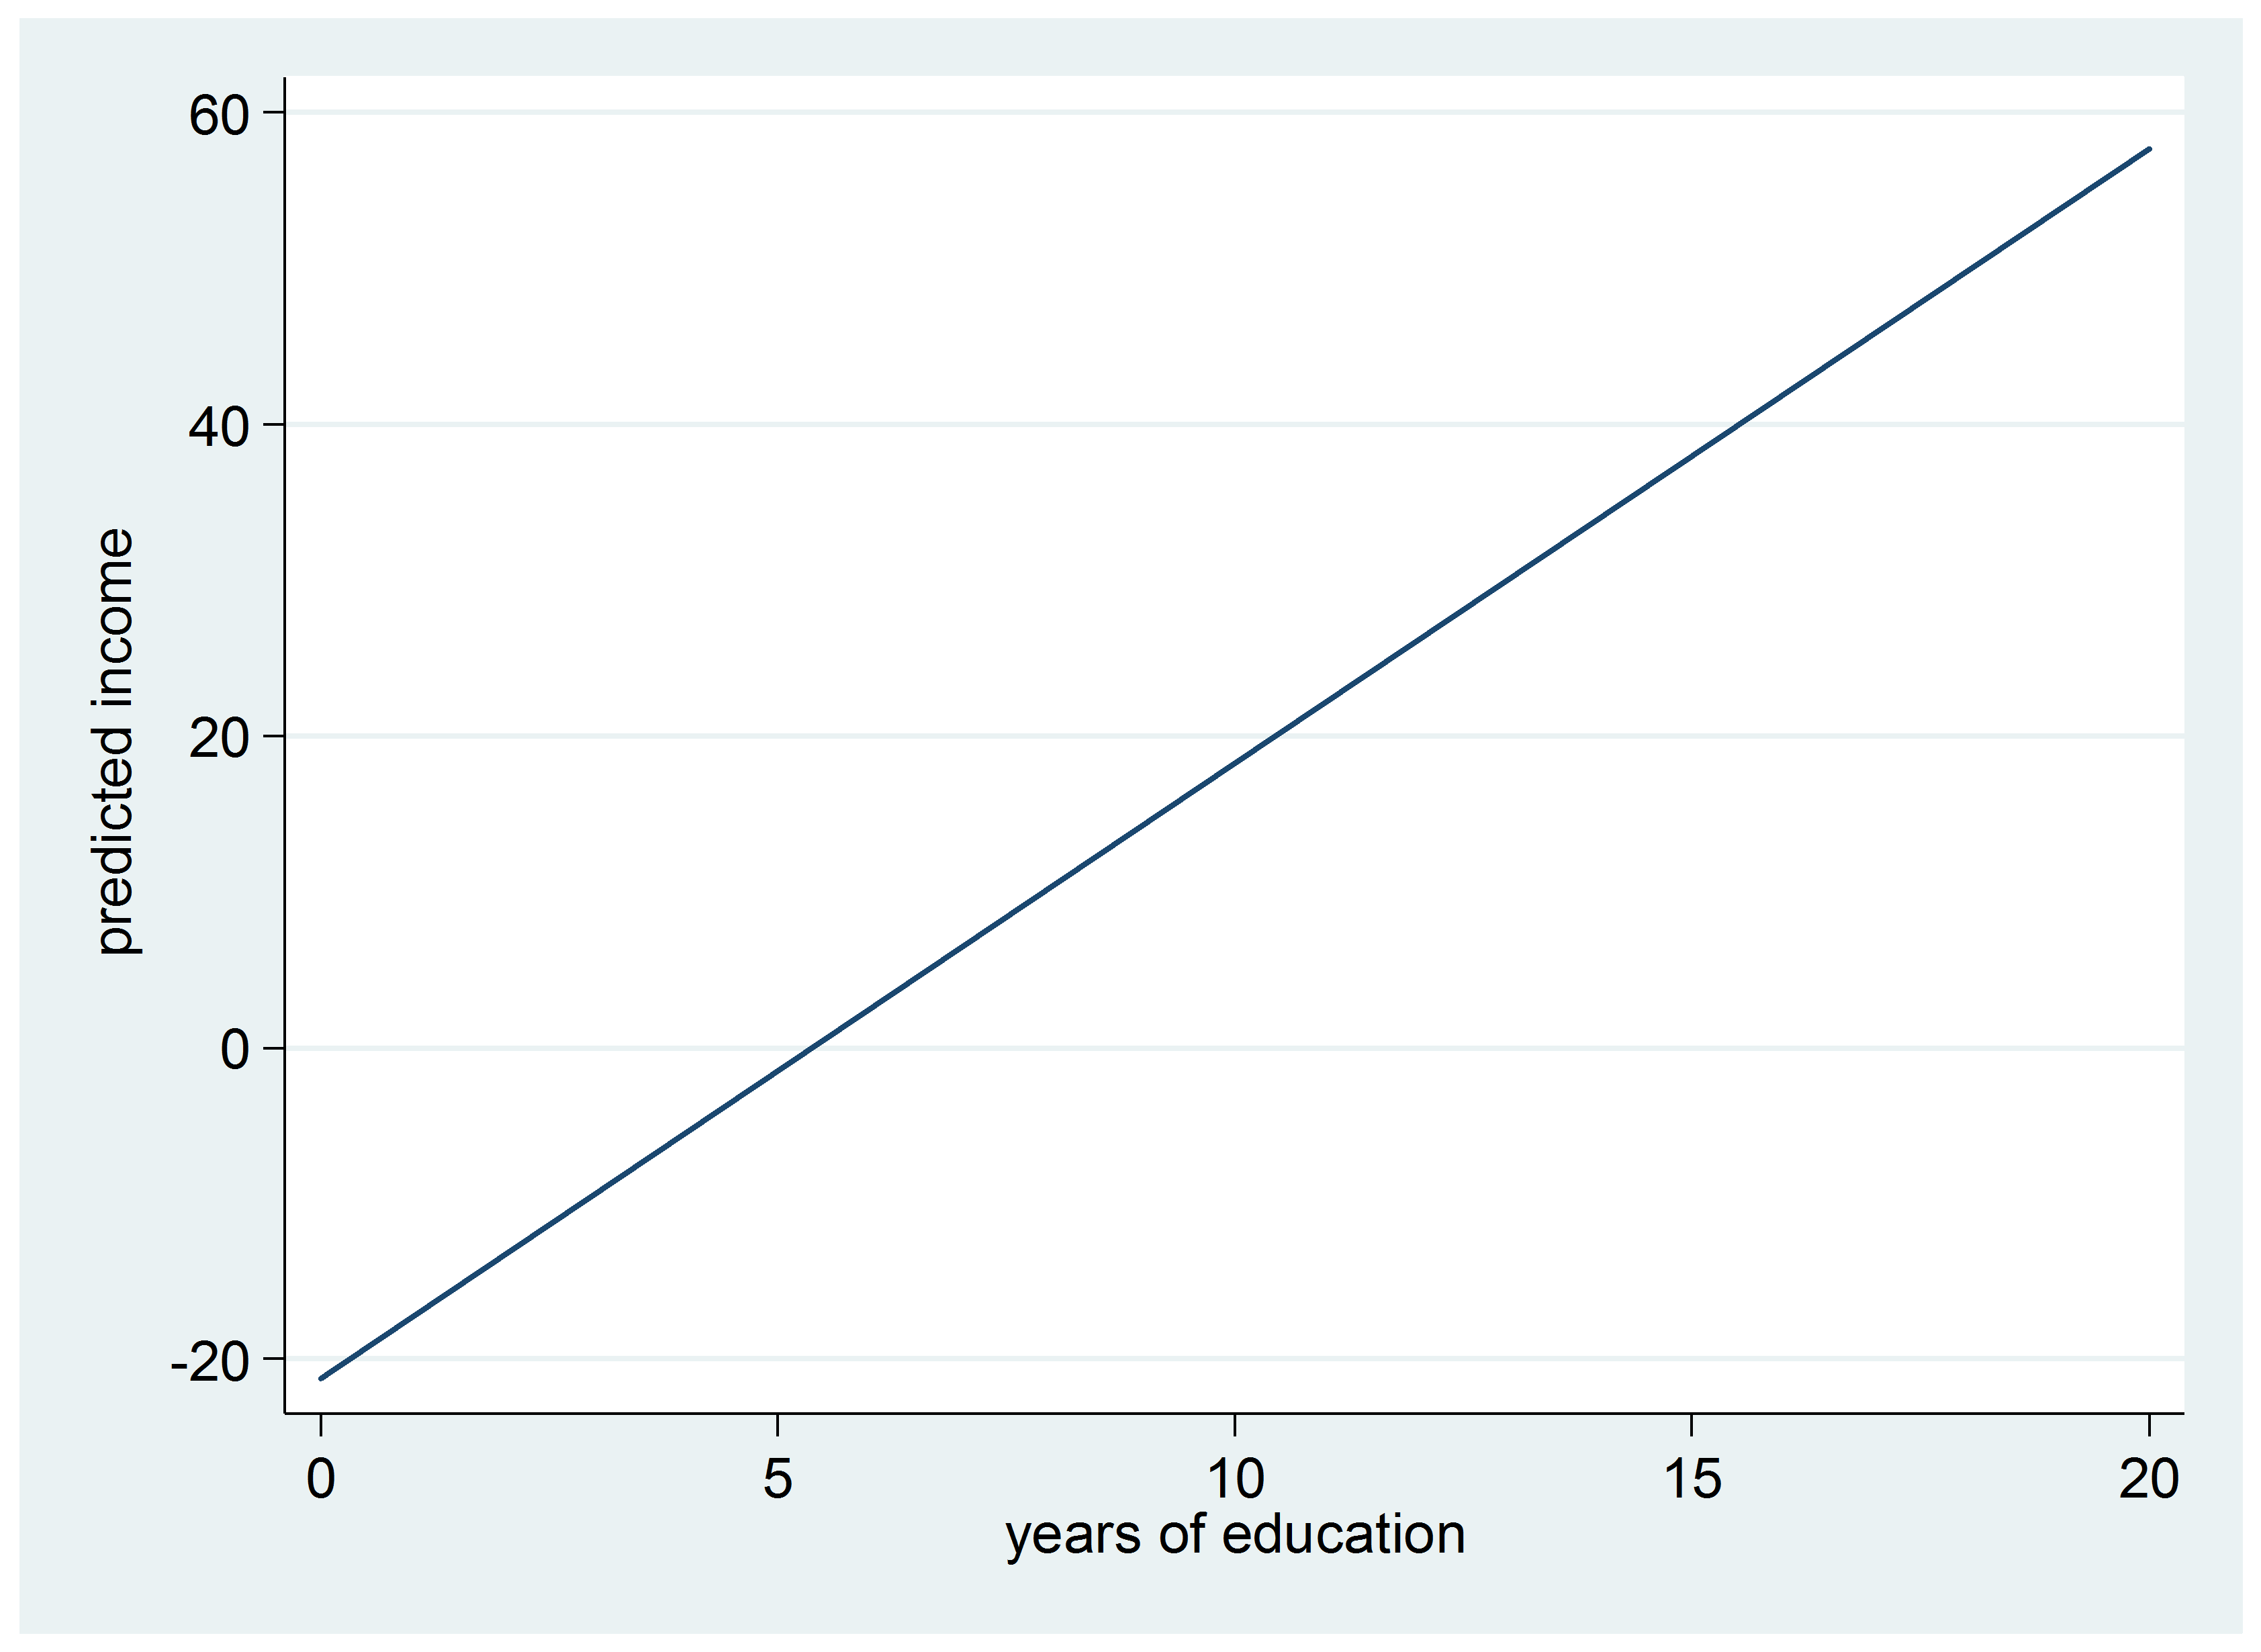
Does it make sense that this rate of increase would remain the same for every level of education? For example, does someone with 11 years of education make about $4,000 less than someone with a high school education?
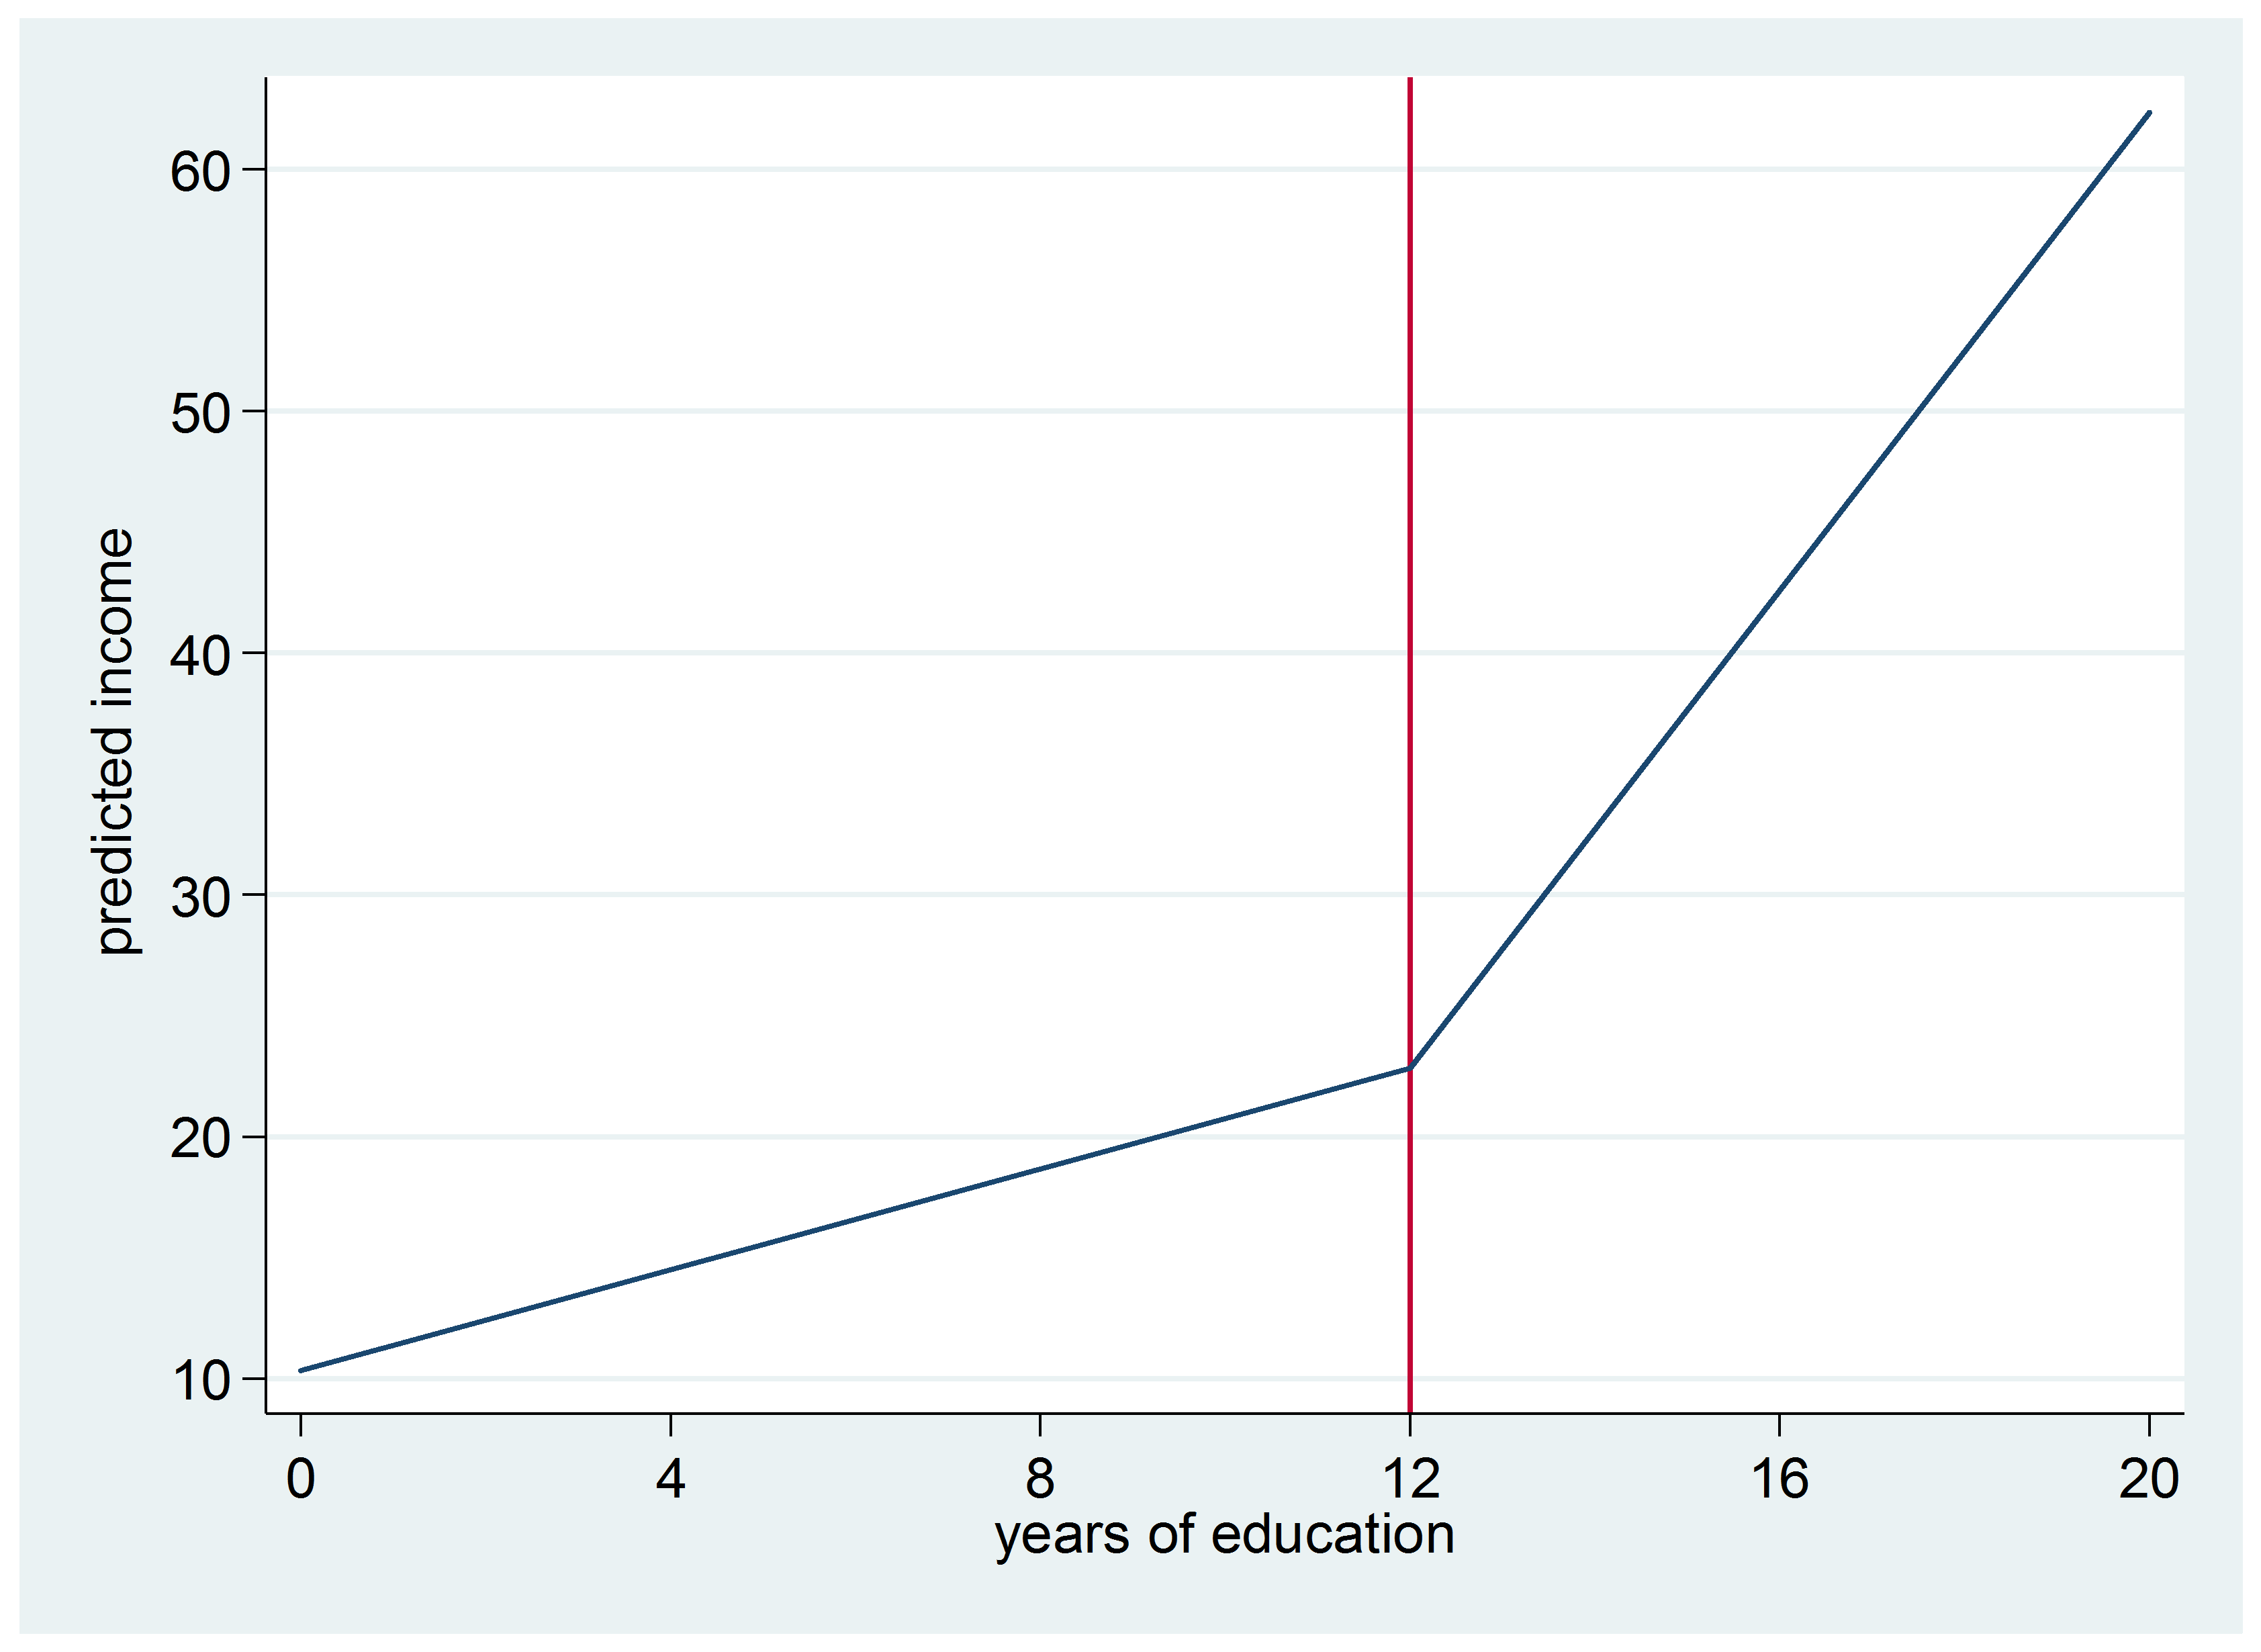
Well, we can make a split at 11.99 years of education to find out:

The first slope, educ1a, is the increase in salary per year of education up to 12 years. For example, someone who went to school up to 11th grade would earn, on average, 10,352 + 11 x 1,040 = $21,792 per year.
Those with more than 12 years of education would earn an additional $4,938 per year for every year of education greater than 12.
Notice in the graph of this model that the y-intercept is no longer -21:
Should we expect an increase for those with a college degree compared to those with 1 to 3 years of college? Let’s add an additional segmentation to find out.
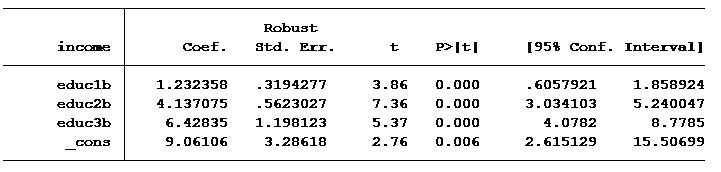
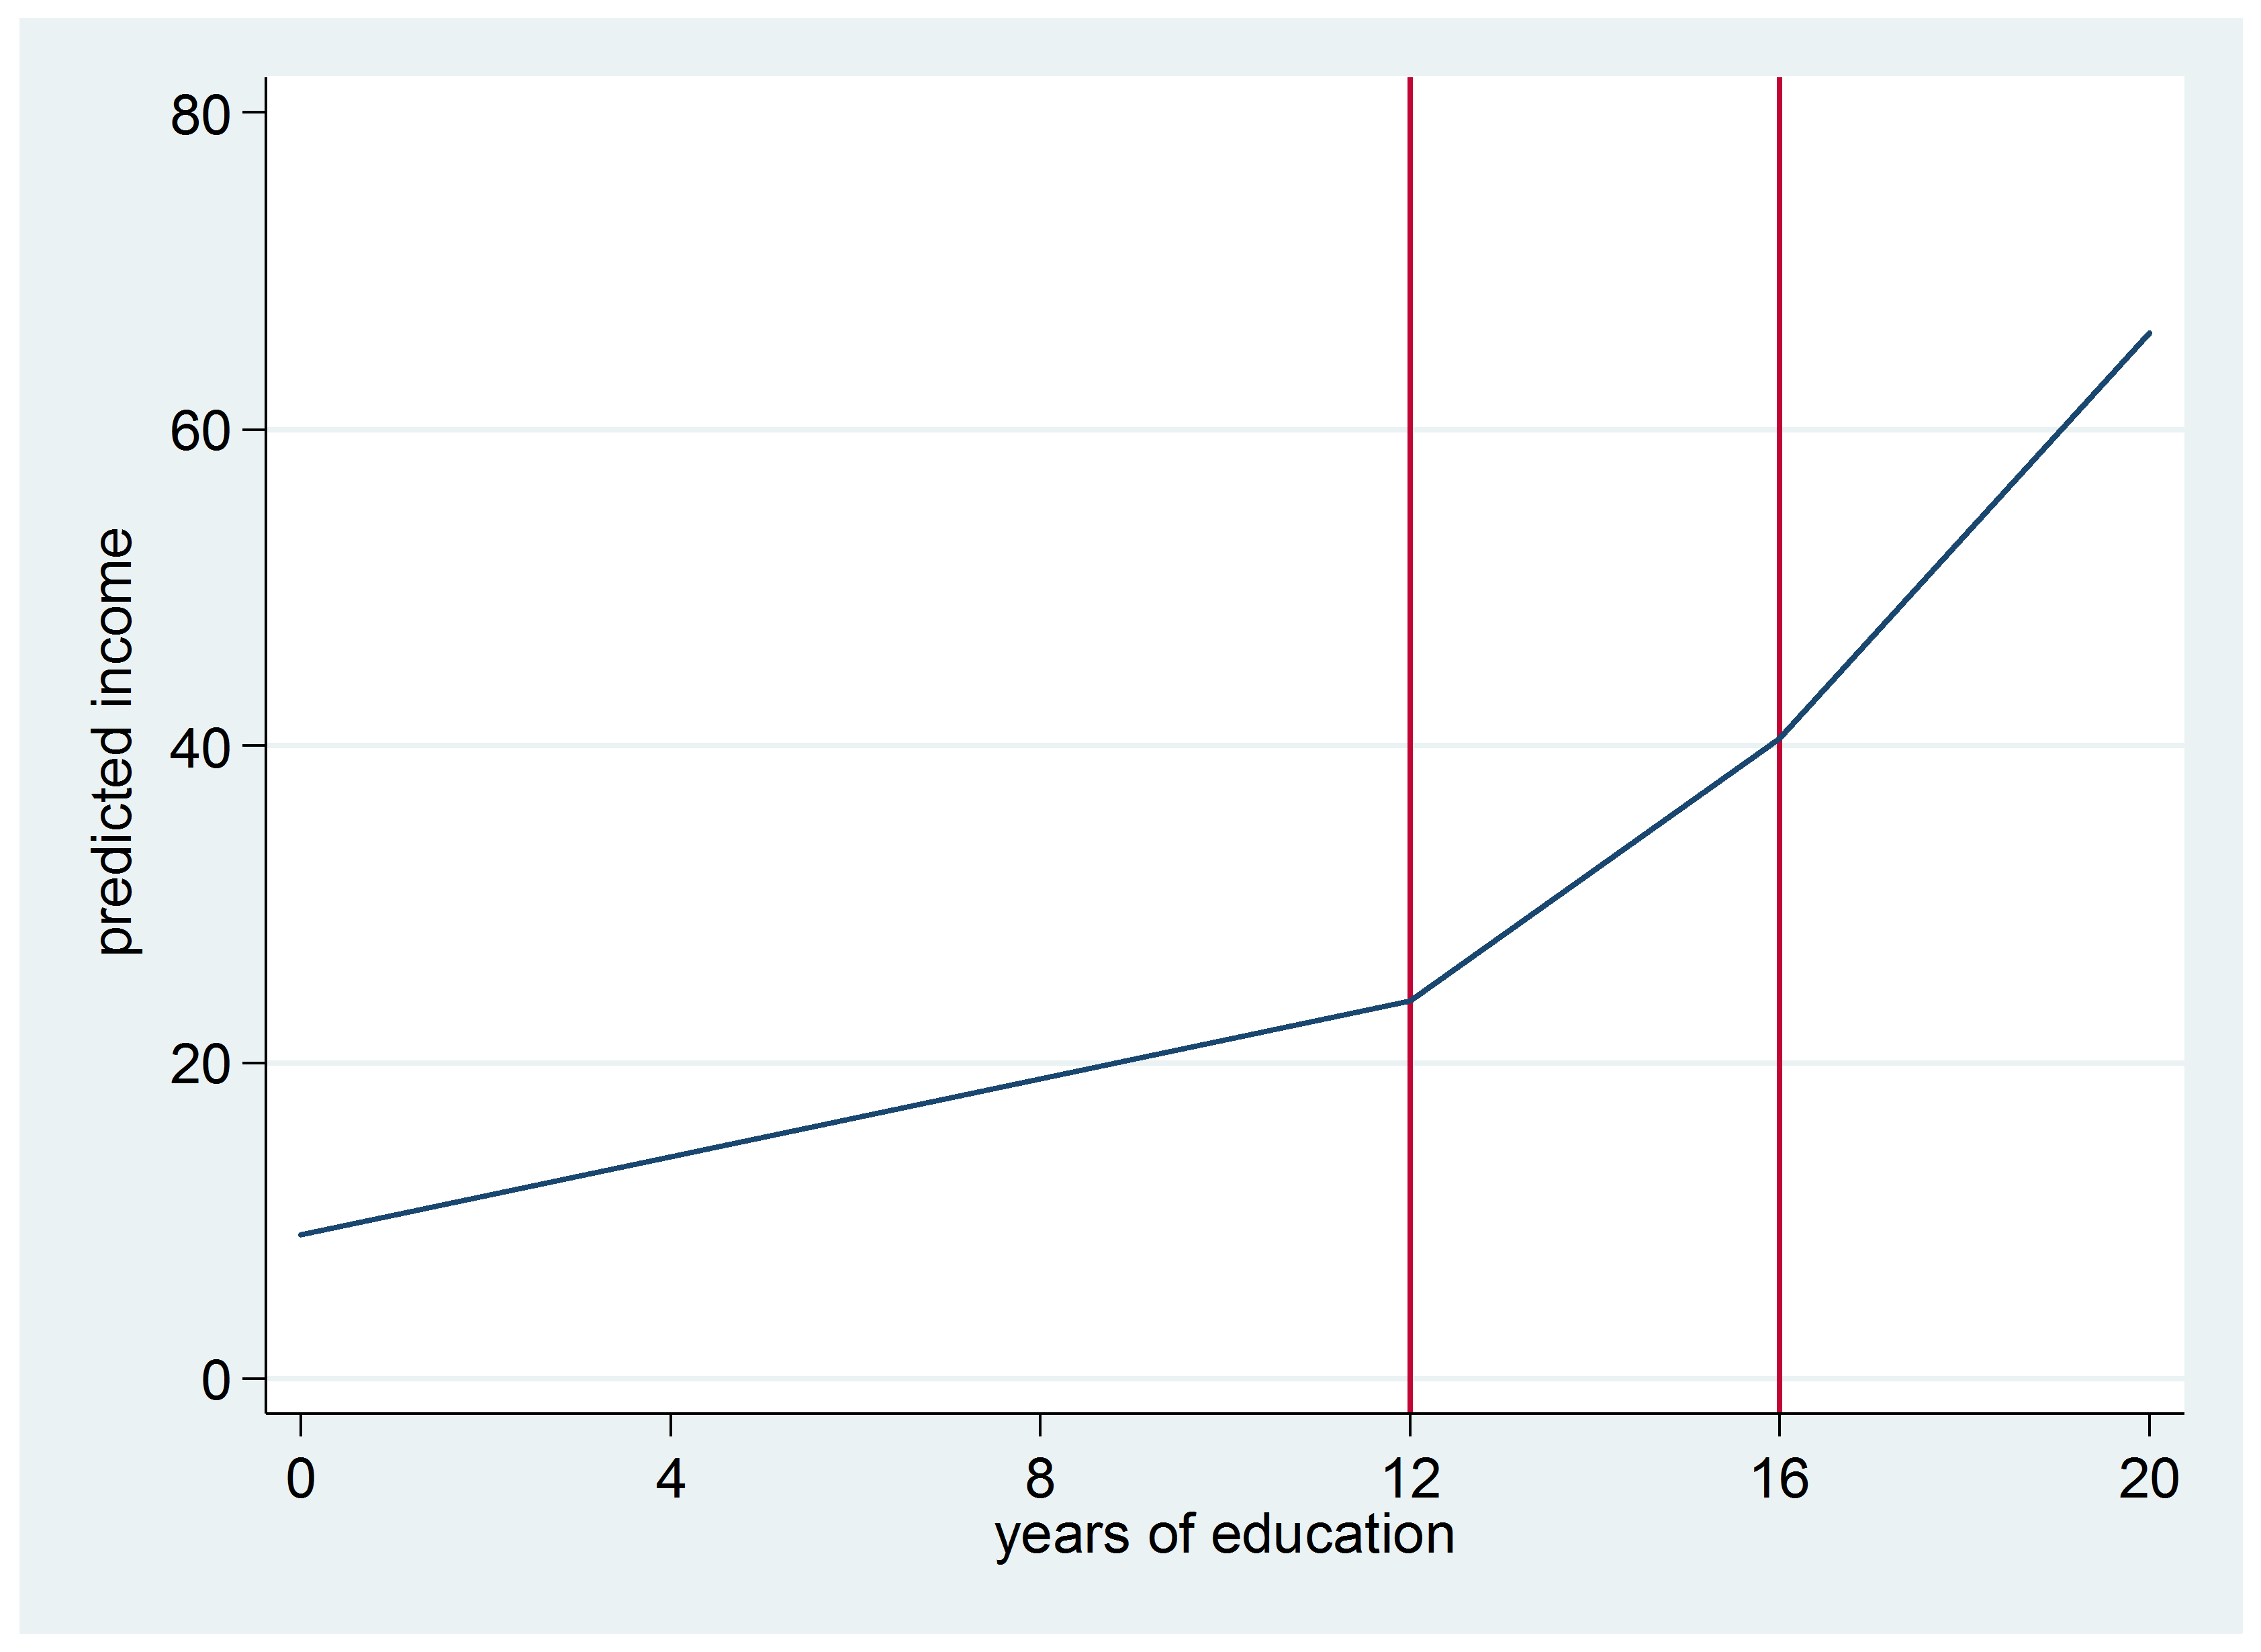
We have now modeled three different slopes for expected salary per number of years of education. The table below shows the average income levels at specific years of education.
Here’s the graph of this model:
|
Years of Education |
Formula |
Mean Income in Thousands |
|
11.999 |
$9.061 +( 11.999 x 1.23) |
$23.85 |
|
13 |
$9.061 +( 11.999 x 1.23)+(1 x 4.13) |
$27.99 |
|
15.99 |
$9.061 +( 11.999 x 1.23)+ (4 x 4.13) |
$40.40 |
|
17 |
$9.061 +( 11.999 x 1.23)+ (4 x 4.13)+(1 x 6.43) |
$46.82 |
Segmented regression is a great option when there are meaningful break points for X. It worked well here because both 12 years and 16 years of education are meaningfully different than other values.
Jeff Meyer is a statistical consultant with The Analysis Factor, a stats mentor for Statistically Speaking membership, and a workshop instructor. Read more about Jeff here.

Hi ya’ll,
I’ve read that a quadratic term also can’t be used unless the spacing of time is even. What would you advise on this?
Hi Nick,
They don’t have to be equal spacing, but the spacing does have to be accurate reflection of the actual spacing. So for example, you could do a quadratic term for a variable Weeks that had values of 0 1, 2, 3, 5, 7, 10, 15, as long as those are the real spacing of the weeks. But if you had those as 0, Time 1, Time 2, Time 3, Time 4, Time 5, etc., that wouldn’t work.
It’s also possible that you might have some spacing somewhere where the values are too far apart and you end up misrepresenting the curvature. So there it isn’t ideal.
What are the diagnostics for assessing the segments? Is there a way to determine an optimal number of segments, as there is with clusters in cluster analysis?
Another approach that is often useful is to use a generalized additive model (GAM) this fits a smooth spline curve of various types – cubic splines are the most popular for each predictor.
In SPSS Statistics, this is available via the STATS GAM extension command. From the help.
This procedure calculates a generalized additive model (GAM). GAMs are linear in predictor terms that can be simple variables or various kinds of splines or polynomials. This preserves the simplicity of the linear model while allowing flexibly for predictors to have a nonlinear effect on the dependent variable. In addition, you can specify the error distribution and link function for the model.
Hi Jeff,
I am interested in you opinion about using the segmented regression concept to Cox PH regression. Naturally the intercepts are no longer relevant / needed.
Thank you,
Horia
Hi Horia,
I don’t consider myself an expert in Cox PH regression. The book “Flexible Parametric Survival Analysis Using Stata: Beyond the Cox Model” has a small discuss about it. The book uses the term piecewise rather than segmented but they are generally interchangeable terms.
Here is a link for piecewise exponential models:
https://data.princeton.edu/wws509/stata/recidivism
Sorry I can’t give you a definitive answer.
Jeff