new blog post: Member Training: The Dark Side of Data Science

Previous Posts
Let’s first look at two similar standardized effect size statistics to see why this happens with odds ratios.
Data analysts can get away without ever understanding matrix algebra, certainly. But there are times when having even a basic understanding of how matrix algebra works and what it has to do with data can really make your analyses make a little more sense.
The Estimated Marginal Means in SPSS GLM are the means of each factor or interaction you specify, adjusted for any other variables in the model.
The practice of choosing predictors for a regression model, called model building, is an area of real craft. There are many possible strategies and approaches and they all work well in some situations. Every one of them requires making a lot of decisions along the way. As you make decisions, one danger to look out […]
For nearly a hundred years the concept of “statistical significance” has been fundamental to statistics and to science. And for nearly that long, it has been controversial and misused as well.
It’s easy to make things complex without meaning to. Especially in statistical analysis. Sometimes that complexity is unavoidable. You have ethical and practical constraints on your study design and variable measurement. Or the data just don’t behave as you expected. Or the only research question of interest is one that demands many variables. But sometimes […]
Missing data is a common problem in data analysis. One of the successful approaches is k-Nearest Neighbor (kNN), a simple approach that leverages known information to impute unknown values with a relatively high degree of accuracy.
Even if you’ve never heard the term Generalized Linear Model, you may have run one. It’s a term for a family of models that includes logistic and Poisson regression, among others. It’s a small leap to generalized linear models, if you already understand linear models. Many, many concepts are the same in both types of […]
by Steve Simon, PhD Hazard functions are a key tool in survival analysis. But they’re not always easy to interpret. In this article, we’re going to explore the definition, purpose, and meaning of hazard functions. Then we’ll explore a few different shapes to see what they tell us about the data. Motivating example This is […]
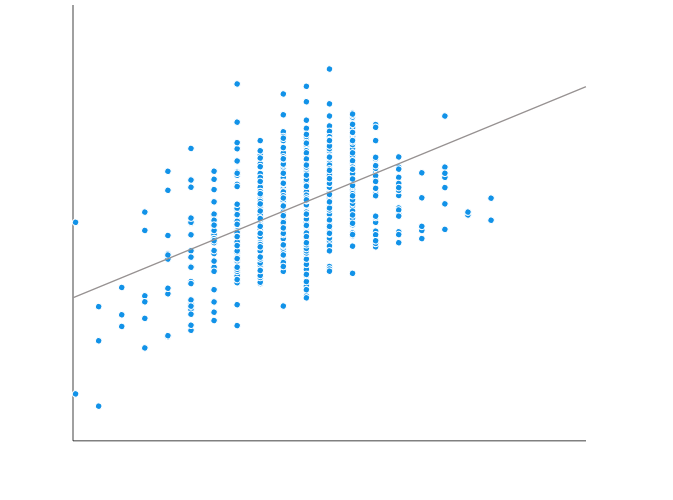
As it has been said a picture is worth a thousand words and so it is with graphics too. A well constructed graph can summarize information collected from tens to hundreds or even thousands of data points. But not every graph has the same power to convey complex information clearly.
 stat skill-building compass