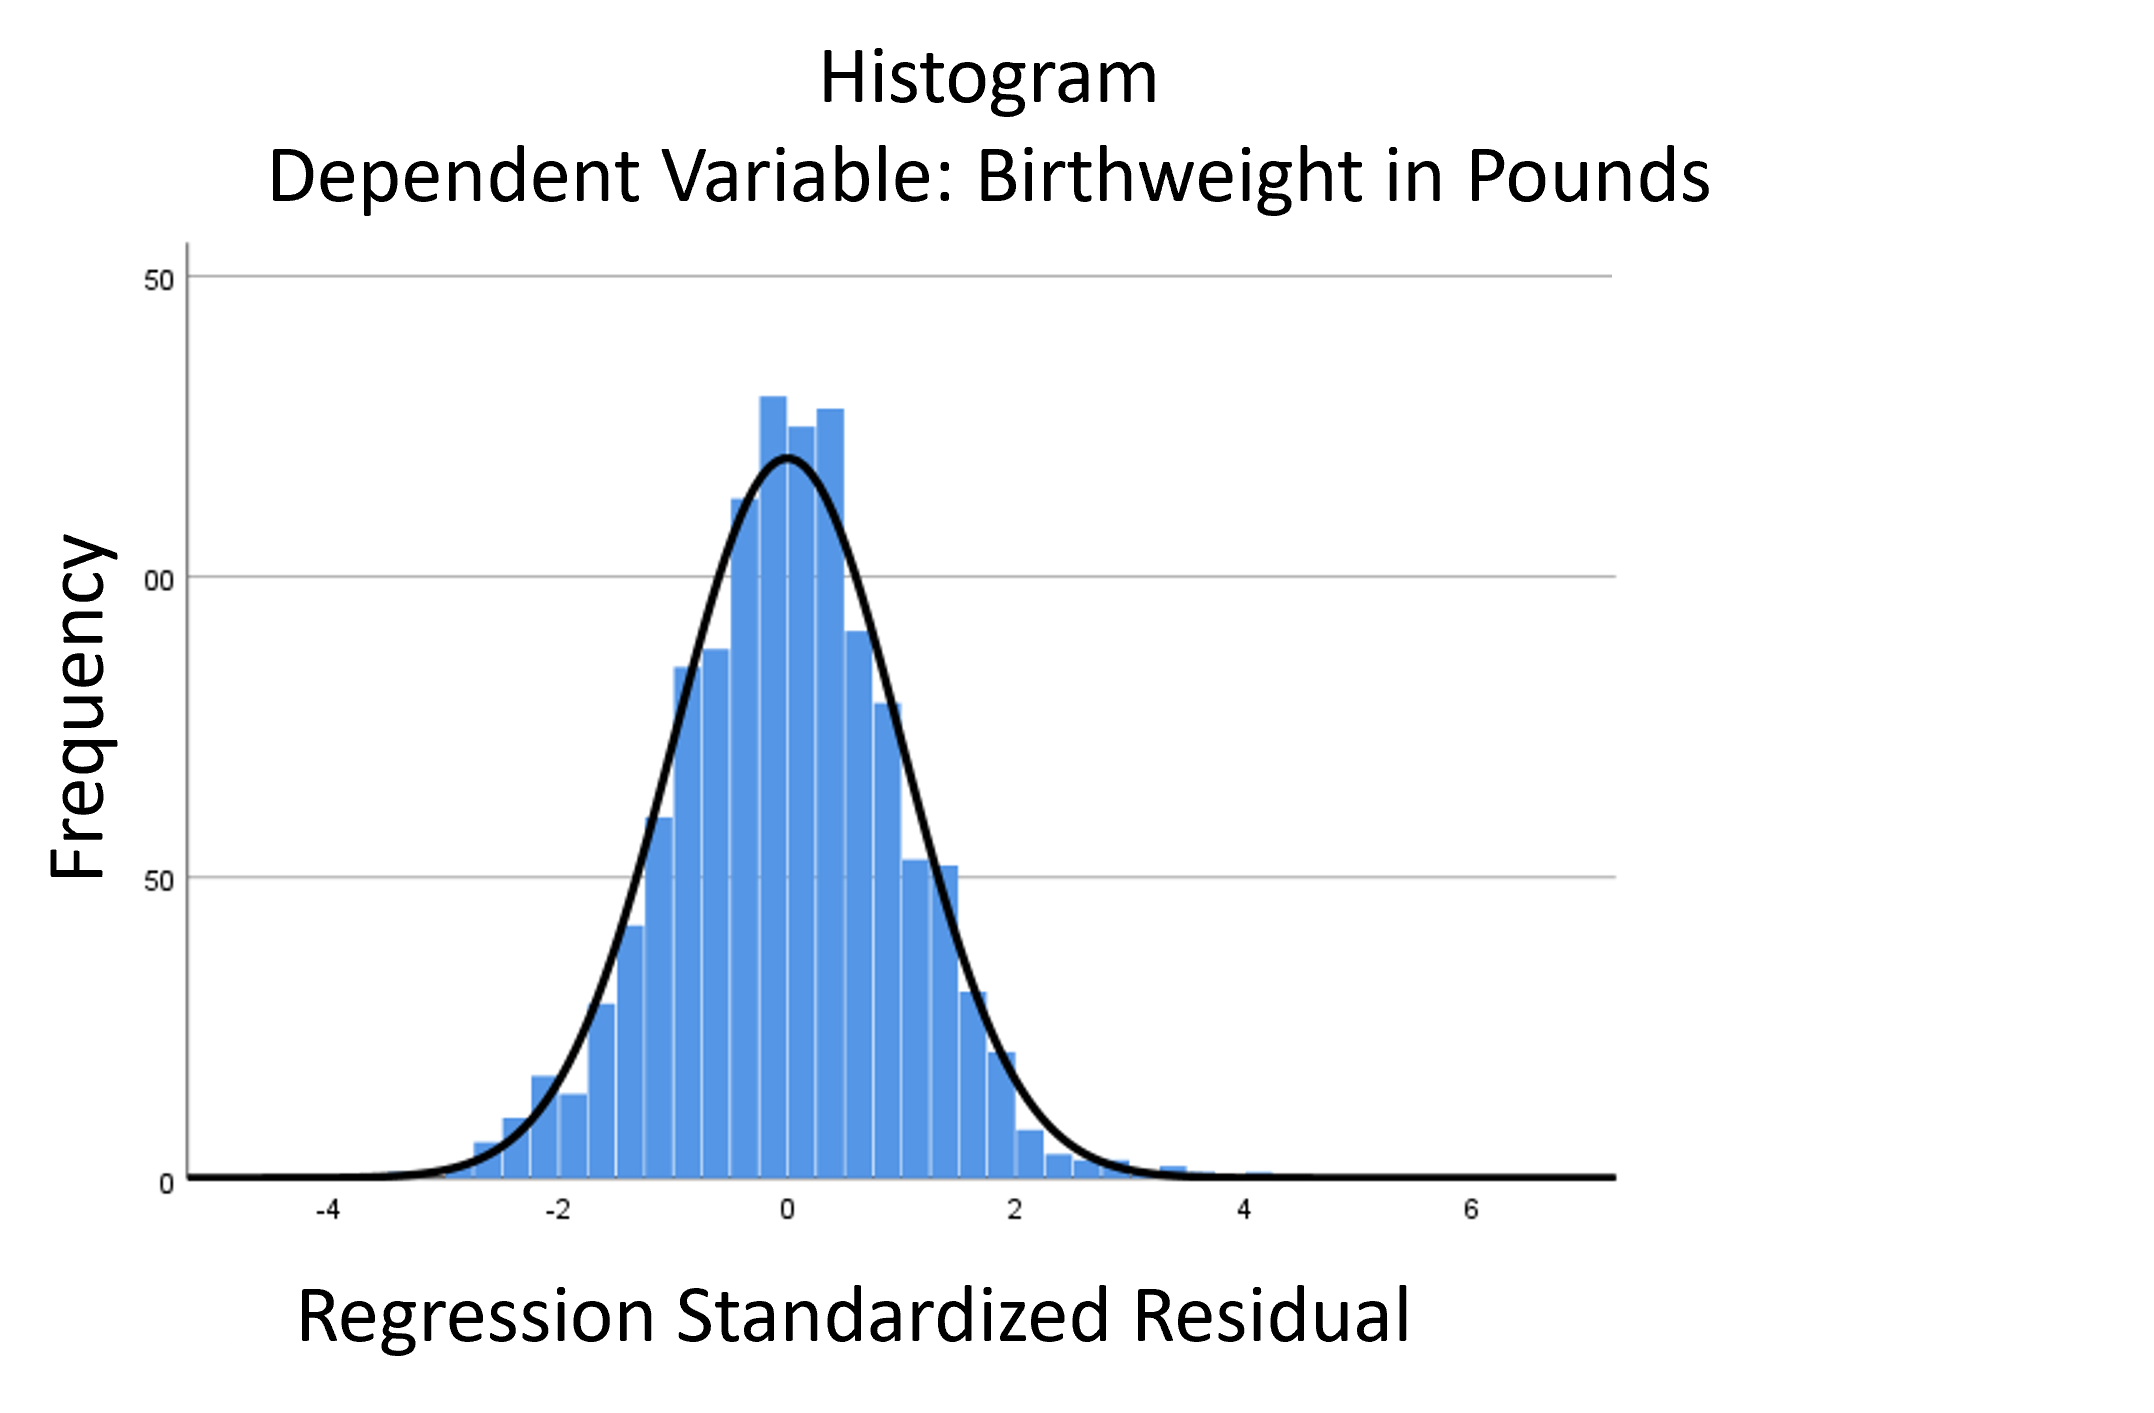
A normal probability plot is extremely useful for checking normality assumptions. It’s more precise than a histogram, which can’t pick up subtle deviations. And yet it doesn’t suffer from too much power from large samples with tiny departures from normality or too little power from small samples with large departures from normality, as do tests like Shaprio-Wilkes.
The biggest problem with a normal probability plot is that it’s hard to read, especially if you’re not used to them. So let’s take a moment and walk through exactly how they work and what they tell you.
There are two versions of normal probability plot: Q-Q and P-P. I’ll start with the Q-Q. (more…)
The first real data set I ever analyzed was from my senior honors thesis as an undergraduate psychology major. I had taken both intro stats and an ANOVA class, and I applied all my new skills with gusto, analyzing every which way.
It wasn’t too many years into graduate school that I realized that these data analyses were a bit haphazard. (Okay, a LOT). And honestly, not at all well thought out.
A few decades of data analysis experience later, I realized that’s just a symptom of being an inexperienced data analyst.
But even experienced data analysts can get off track. It’s especially easy with large data sets with many variables. It’s just so tempting to try one thing, then another, and pretty soon you’ve spent weeks getting nowhere.(more…)
The linear model normality assumption, along with constant variance assumption, is quite robust to departures. That means that even if the assumptions aren’t met perfectly, the resulting p-values and confidence intervals will still be reasonable estimates.
This is great because it gives you a bit of leeway to run linear models, which are intuitive and (relatively) straightforward. This is true for both linear regression and ANOVA.
You do need to check the assumptions anyway, though. You can’t just claim robustness and not check. Why? Because some departures are so far off that the p-values and confidence intervals become inaccurate. And in many cases there are remedial measures you can take to turn non-normal residuals into normal ones.
But sometimes you can’t.
Sometimes it’s because the dependent variable just isn’t appropriate for a linear model. The (more…)
When you learned analysis of variance (ANOVA), it’s likely that the emphasis was on the ANOVA table, with its Sums of Squares and F tests, followed by a post-hoc test. But ANOVA is quite flexible in how it can compare means. A large part of that flexibility comes from its ability to perform many types of statistical contrast.
That F test can tell you if there is evidence your categories are different from each other, which is a start. It is, however, only a start. Once you know at least some categories’ means are different, your next question is “How are they different?” This is what a statistical contrast can tell you.
What is a Statistical Contrast?
A statistical contrast is a comparison of a combination of the means of two or more categories. In practice, they are usually performed as a follow up to the ANOVA F test. Most statistical programs include contrasts as an optional part of ANOVA analysis. (more…)
The classic way to compare means in analysis of variance is examining pairwise differences in means after an F test.. It’s great for many problems, but sometimes your research question isn’t about pairwise differences.
Pairwise differences are not ideal if your research question is if, like the Sesame Street song, one of these groups is not like the others. Perhaps, you are trying to assure that groups conform to a common standard. Analysis of Means (ANOM) helps in all these settings. (more…)
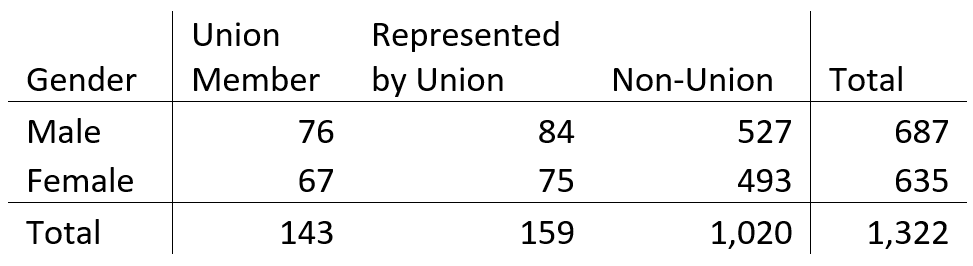
A chi square test is often applied to two-way tables, like the one below.
This table represents a sample of 1,322 individuals. Of these individuals, 687 are male, and 635 are female. Also 143 are union members, 159 are represented by unions, and 1,020 are not affiliated with a union.
You might use a chi-square test if you want to learn something about the relationship of gender and union status. The question then might come up: should you use a test of independence, or a test of homogeneity?
Does it matter? Software doesn’t generally differentiate between the two, which leads to a final question: are they even different?
Well, yes and no. Read on!
Different: Independence versus Homogeneity
Independence and homogeneity do refer to different ideas. If union status and gender are independent, that means that union status and gender are unrelated. In other words, if you know someone’s union status, you won’t be able to make a better guess as to their gender.
If you know someone’s gender, you won’t be able to make a better guess as to their union status.
Homogeneity is different and refers to the concept of similarity. If you are familiar with linear regression, you might associate this with residuals. Residuals should be homogeneous, meaning they all come from the same distribution.
That idea applies to this two-way table as well. We may want to know if the distribution of union status is the same for men and women. In other words, does union status come from the same distribution for both men and women?
To test independence, we would not approach the question from the standpoint of gender or union status. We would take a sample of all employed individuals, and then break them down into the categories in the table.
To test homogeneity, we would approach it from the standpoint of gender. We would randomly sample individuals from within each gender, and then measure their union status.
Either approach would result in the table above.
Same: Chi-Square Statistics
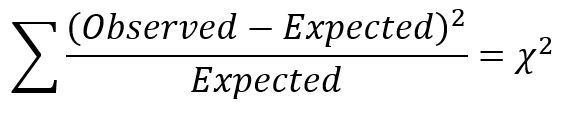
Chi-square statistics for categorical data generally follow this formula:
For each of the six cells representing a combination of gender and union status, the number in the cell is the count we observe. “Expected” refers to what we would see in each cell under the null hypothesis. That means if gender and union status are independent (or if union status is homogeneous across the genders).
We calculate the difference, square it, and divide by the expected count for each cell. We then add these all together, and that is the chi-square test statistic.
Where do we get the expected counts for each cell?
Let’s examine the combination of male and union member under independence. If gender and union membership are independent, then how many male union members do we expect? Well,
– 10.81% of the sample are union members
– 51.96% are male
So, if they are independent, 10.81% x 51.96% is 5.62%, and 5.62% of 1,322 is 74.3. This is how many individuals we would expect to be male union members.
Now let’s consider male union members under homogeneity. Overall, 10.81% of the sample are union members. If this is the same for both males and females, then of the 687 males, we expect 74.3 to be union members.
Independence and homogeneity result in the same expected number of union members! It turns out this calculation is the same for every cell in the table. It follows that the chi-square statistic is also the same.
Does It Matter?
As it turns out, independence and homogeneity are two sides of the same coin. If gender and union status are independent, then union status is distributed the same way for males and females.
So which test should you say you are using, if they turn out the same?
Again, that comes back to how you have phrased your research question. Are you determining whether gender and union status are related. That is a test of independence. Are you looking for differences between males and females? That is a test of homogeneity.
The Analysis Factor uses cookies to ensure that we give you the best experience of our website. If you continue we assume that you consent to receive cookies on all websites from The Analysis Factor.
This website uses cookies to improve your experience while you navigate through the website. Out of these, the cookies that are categorized as necessary are stored on your browser as they are essential for the working of basic functionalities of the website. We also use third-party cookies that help us analyze and understand how you use this website. These cookies will be stored in your browser only with your consent. You also have the option to opt-out of these cookies. But opting out of some of these cookies may affect your browsing experience.
Necessary cookies are absolutely essential for the website to function properly. This category only includes cookies that ensures basic functionalities and security features of the website. These cookies do not store any personal information.
Any cookies that may not be particularly necessary for the website to function and is used specifically to collect user personal data via analytics, ads, other embedded contents are termed as non-necessary cookies. It is mandatory to procure user consent prior to running these cookies on your website.
 A normal probability plot is extremely useful for checking normality assumptions. It’s more precise than a histogram, which can’t pick up subtle deviations. And yet it doesn’t suffer from too much power from large samples with tiny departures from normality or too little power from small samples with large departures from normality, as do tests like Shaprio-Wilkes.