In this video I will answer another question from a recent webinar, Random Intercept and Random Slope Models.
We are answering questions here because we had over 500 people live on the webinar so we didn’t have time to get through all the questions.
In this video I will answer another question from a recent webinar, Random Intercept and Random Slope Models.
We are answering questions here because we had over 500 people live on the webinar so we didn’t have time to get through all the questions.
In this video I will answer a question from a recent webinar, Random Intercept and Random Slope Models.
We are answering questions here because we had over 500 people live on the webinar so we didn’t have time to get through all the questions.
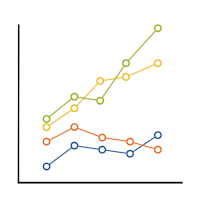
Mixed models can account for different spacing in time and you’re right, it entirely depends on whether you treat Time as categorical or continuous.
First let me mention that not all designs can treat time as either categorical or continuous. The reason it could go either way in your example is because time is measured discretely, yet there are enough numerical values that you could fit a line to it. (more…)
 As mixed models are becoming more widespread, there is a lot of confusion about when to use these more flexible but complicated models and when to use the much simpler and easier-to-understand repeated measures ANOVA.
One thing that makes the decision harder is sometimes the results are exactly the same from the two models and sometimes the results are (more…)
In a previous post we discussed using marginal means to explain an interaction to a non-statistical audience. The output from a linear regression model can be a bit confusing. This is the model that was shown.
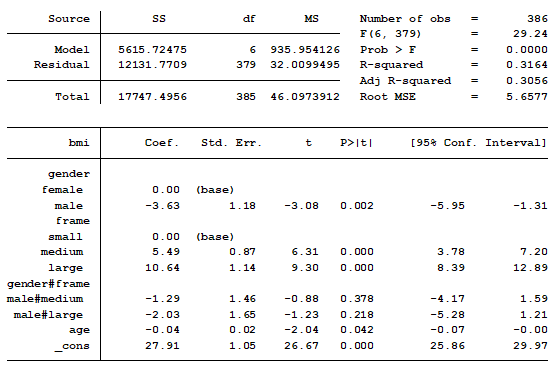
In this model, BMI is the outcome variable and there are three predictors:
 When you put a continuous predictor into a linear regression model, you assume it has a constant relationship with the dependent variable along the predictor’s range. But how can you be certain? What is the best way to measure this?
And most important, what should you do if it clearly isn’t the case?
Let’s explore a few options for capturing a non-linear relationship between X and Y within a linear regression (yes, really). (more…)