The following statement might surprise you, but it’s true.
To run a linear model, you don’t need an outcome variable Y that’s normally distributed. Instead, you need a dependent variable that is:
- Continuous
- Unbounded
- Measured on an interval or ratio scale
The normality assumption is about the errors in the model, which have the same distribution as Y|X. It’s absolutely possible to have a skewed distribution of Y and a normal distribution of errors because of the effect of X.
This issue came up recently in a free webinar I conducted in our The Craft of Statistical Analysis program about Binary, Ordinal, and Nominal Logistic Regression.
The first thing we did in that webinar was a (very brief) review of linear regression so that we could compare and contrast logistic to linear models.
We had over 1200 people sign up and while I answered a lot of questions, I didn’t get through all of them. So I’m answering some here on the site.
They’re grouped by topic, and you will probably get more out of it if you watch the webinar recording. It’s free.
Today’s group of questions were all about this aspect of linear models and how they relate to the example I used in the webinar.
In my (fake data) example, the DV was GPA and one of the IVs was SAT Math score. Here is the equation we fit:
E(College GPA) = -.03 + .20*HSGPA + .003*SATV + .002*SATM -.15*Sports -.26*Male
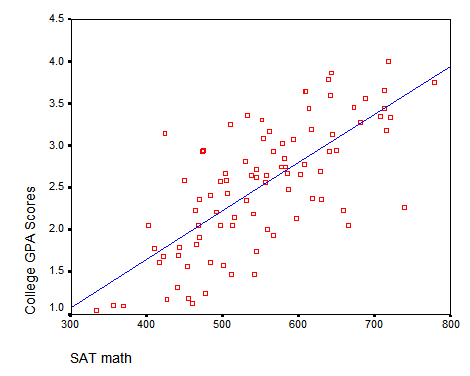
And this is the bivariate relationship between SATM scores and College GPA.
And my astute listeners asked versions of this question:
Q: On slide 4 it says the linear model dependent variable needs to be unbounded, but SAT scores and GPA scores are bounded. I’m confused.
And my multi-part answer:
- Oops.
Yes, it’s true. A better example would have used a dependent variable that truly had no bounds. GPA isn’t one—it’s bounded at 4.0 at the top and 0 at the bottom. See #3 for why I got away with it anyway.
- SAT math score, a predictor, which is also bounded between 200 and 800, is irrelevant.
As it turns out, the distributions of the predictors don’t generally matter. It’s the outcome variable whose distribution matters.
(Notice I threw that “generally” in there. If a huge proportion of the SAT math scores were at the boundary, that might cause influence problems. But it’s unlikely to create problems with the normality of errors assumption that we’re concerned with here.)
- I managed to get away with it here simply because although there are theoretical bounds, only one data value actually hit one of them.
Here’s the histogram of GPA scores. One person in this data set had a 4.0 GPA. No one got close to 0.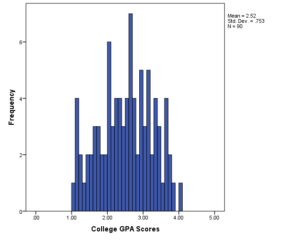
Yes, I absolutely may get predicted values from this model that are above 4.0 or below 0.0 and they won’t make sense.
But I can live with that. It’s really an issue of censoring. Maybe some students should have GPAs greater than 4.0 or below 0.0. But we can only measure GPAs in this 0-4 range.
In other words, if there were a lot of students with 4.0 GPAs, perhaps they really shouldn’t all have the same GPA. Perhaps some actually did better in their classes than others, but the top grade anyone could get was a 4.0.
The problem for linear regression is that if we have this ceiling or floor effect, we’ll have a lot of values against the bounds and we’ll have a lot of trouble meeting that assumption of normal errors.
So while I have theoretical bounds, I’m not hitting them with the data. There are a lot of variables that technically have boundaries that no observations hit.
When that happens, you can still trust your coefficients, standard errors, and p-values. You will, of course, have to check your assumptions.

Hi Karen,
Than you for your nice explanation. I found in your GPA histogram, lot of persons get values close to 4. Do you think that may create any problem in your regression output? Moreover, if I consider this as problem then what alternative model you could suggest?
Thanks
Aziz
Hi Karen, thank you for your many excellent posts. What kind of regression would be appropriate for a continuous dependable variable that has only a lower bound (zero) and no upper bound
Hi Rao,
Unfortunately, it depends. Here are a few options, depending on how many 0s there are and the distribution.
Gamma regression (a type of generalized linear model)
Zero-inflated linear regression
A linear regression with a log link
Dear Karen
If one performs an unordered multinomial logistic regression and gets the output comparing P1 vs P3 and P2 vs P3 (P3 is the reference group), how can we compare P1 vs P2?
best regards
leandro
Leandro, It turns out that if you simply subtract the coefficients from the first two models, you would get the coefficients for the third.