There are not a lot of statistical methods designed just for ordinal variables. (There are a few, though.) 
But that doesn’t mean that you’re stuck with few options. There are more than you’d think. (more…)
There are not a lot of statistical methods designed just for ordinal variables. (There are a few, though.)
But that doesn’t mean that you’re stuck with few options. There are more than you’d think. (more…)
Updated 12/20/2021
Despite its popularity, interpreting regression coefficients of any but the simplest models is sometimes, well….difficult.
So let’s interpret the coefficients in a model with two predictors: a continuous and a categorical variable. The example here is a linear regression model. But this works the same way for interpreting coefficients from any regression model without interactions.
A linear regression model with two predictor variables results in the following equation:
Yi = B0 + B1*X1i + B2*X2i + ei.
The variables in the model are:
The parameters in the model are:
One example would be a model of the height of a shrub (Y) based on the amount of bacteria in the soil (X1) and whether the plant is located in partial or full sun (X2).
Height is measured in cm. Bacteria is measured in thousand per ml of soil. And type of sun = 0 if the plant is in partial sun and type of sun = 1 if the plant is in full sun.
Let’s say it turned out that the regression equation was estimated as follows:
Y = 42 + 2.3*X1 + 11*X2
B0, the Y-intercept, can be interpreted as the value you would predict for Y if both X1 = 0 and X2 = 0.
We would expect an average height of 42 cm for shrubs in partial sun with no bacteria in the soil. However, this is only a meaningful interpretation if it is reasonable that both X1 and X2 can be 0, and if the data set actually included values for X1 and X2 that were near 0.
If neither of these conditions are true, then B0 really has no meaningful interpretation. It just anchors the regression line in the right place. In our case, it is easy to see that X2 sometimes is 0, but if X1, our bacteria level, never comes close to 0, then our intercept has no real interpretation.
Since X1 is a continuous variable, B1 represents the difference in the predicted value of Y for each one-unit difference in X1, if X2 remains constant.
This means that if X1 differed by one unit (and X2 did not differ) Y will differ by B1 units, on average.
In our example, shrubs with a 5000/ml bacteria count would, on average, be 2.3 cm taller than those with a 4000/ml bacteria count. They likewise would be about 2.3 cm taller than those with 3000/ml bacteria, as long as they were in the same type of sun.
(Don’t forget that since the measurement unit for bacteria count is 1000 per ml of soil, 1000 bacteria represent one unit of X1).
Similarly, B2 is interpreted as the difference in the predicted value in Y for each one-unit difference in X2 if X1 remains constant. However, since X2 is a categorical variable coded as 0 or 1, a one unit difference represents switching from one category to the other.
B2 is then the average difference in Y between the category for which X2 = 0 (the reference group) and the category for which X2 = 1 (the comparison group).
So compared to shrubs that were in partial sun, we would expect shrubs in full sun to be 11 cm taller, on average, at the same level of soil bacteria.
Don’t forget that each coefficient is influenced by the other variables in a regression model. Because predictor variables are nearly always associated, two or more variables may explain some of the same variation in Y.
Therefore, each coefficient does not measure the total effect on Y of its corresponding variable. It would if it were the only predictor variable in the model. Or if the predictors were independent of each other.
Rather, each coefficient represents the additional effect of adding that variable to the model, if the effects of all other variables in the model are already accounted for.
This means that adding or removing variables from the model will change the coefficients. This is not a problem, as long as you understand why and interpret accordingly.
I’ve given you the basics here. But interpretation gets a bit trickier for more complicated models, for example, when the model contains quadratic or interaction terms. There are also ways to rescale predictor variables to make interpretation easier.
So here is some more reading about interpreting specific types of coefficients for different types of models:
Centering a covariate –a continuous predictor variable–can make regression coefficients much more interpretable. That’s a big advantage, particularly when you have many coefficients to interpret. Or when you’ve included terms that are tricky to interpret, like interactions or quadratic terms.
For example, say you had one categorical predictor with 4 categories and one continuous covariate, plus an interaction between them.
First, you’ll notice that if you center your covariate at the mean, there is (more…)
Survey questions are often structured without regard for ease of use within a statistical model.
Take for example a survey done by the Centers for Disease Control (CDC) regarding child births in the U.S. One of the variables in the data set is “interval since last pregnancy”. Here is a histogram of the results.
At times it is necessary to convert a continuous predictor into a categorical predictor. For example, income per household is shown below.
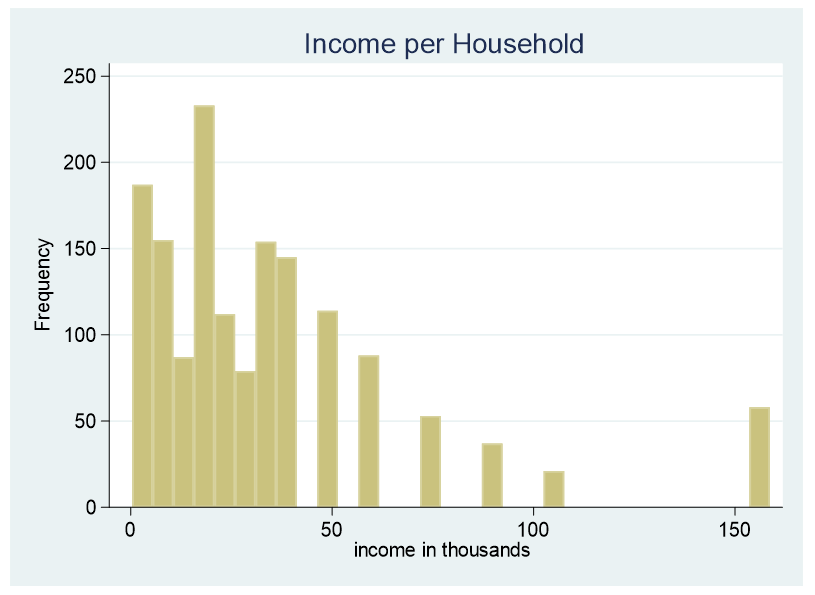
This data is censored, all family income above $155,000 is stated as $155,000. A further explanation about censored and truncated data can be found here. It would be incorrect to use this variable as a continuous predictor due to its censoring.
What’s a good method for interpreting the results of a model with two continuous predictors and their interaction?
Let’s start by looking at a model without an interaction. In the model below, we regress a subject’s hip size on their weight and height. Height and weight are centered at their means.