
You’ll be excited to hear we’re doing another Statistics Skills Accelerator for our Statistically Speaking members: Count Models.
Stats Skills Accelerators are structured events focused on an important topic. They feature Stat’s Amore Trainings in a suggested order, as well as 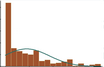 live Q&As specific to the Accelerator.
In August, our mentors will be running a new Accelerator. The first Q&A is August 6, 2025 at 3 pm ET, hosted by Jeff Meyer.
Count models are used when the outcome variable in a model or group comparison is a discrete count:
- Number of eggs in a clutch
- Number of days in intensive care
- Number of aggressive incidents in detention
Count models come in a few types, and any of these can also be used for rates:
- Poisson Regression is the simplest and is the basis for all the other models, but its assumptions are rarely met with real data.
- Negative Binomial regression adds an extra parameter to a Poisson regression measure the extra variance that often occurs in real data.
- Truncated count models work when the lowest values (often just zero) cannot occur. This happens when a count has to occur in order to be part of the population of interest.
- Zero inflated count models are used when there are more zeros than expected. For this model, some zeros could have been something else and others couldn’t.
- Hurdle models also work when there are more zeros than expected, but the process of having a zero is different. In these models, there is an actual “hurdle” one has to pass in order to have a non-zero count.
- Logistic regression, when your count is out of of maximum number.
In this accelerator, learn about the different types of count models, how to understand their results, how to apply them to rates, and how to choose among them.
Note: This training is an exclusive benefit to members of the Statistically Speaking Membership Program and is a combination of watching recorded trainings and live events.
(more…)
When our outcome variable is the frequency of occurrence of an event, we will typically use a count model to analyze the results. There are numerous count models. A few examples are: Poisson, negative binomial, zero-inflated Poisson and truncated negative binomial.
There are specific requirements for which count model to use. The models are not interchangeable. But regardless of the model we use, there is a very important prerequisite that they all share.
(more…)
One important yet difficult skill in statistics is choosing a type model for different data situations. One key consideration is the dependent variable.
For linear models, the dependent variable doesn’t have to be normally distributed, but it does have to be continuous, unbounded, and measured on an interval or ratio scale.
Percentages don’t fit these criteria. Yes, they’re continuous and ratio scale. The issue is the (more…)
We previously examined why a linear regression and negative binomial regression were not viable models for predicting the expected length of stay in the hospital for people with the flu. A linear regression model was not appropriate because our outcome variable, length of stay, was discrete and not continuous.
A negative binomial model wasn’t the proper choice because the minimum length of stay is not zero. The minimum length of stay is one day. Negative binomial and Poisson models can only be used on data where the observations’ outcome have the possibility of having a zero count.
We need to use a truncated negative binomial model to analyze the expected length of stay of people admitted to the hospital who have the flu. Calculating the expected length of stay is an easy task once we create our model. (more…)
Imagine this scenario:
This year’s flu strain is very vigorous. The number of people checking in at hospitals is rapidly increasing. Hospitals are desperate to know if they have enough beds to handle those who need their help.
You have been asked to analyze a previous year’s hospitalization length of stay by people with the flu who had been admitted to the hospital. The predictors in your data set are age group, gender and race of those admitted. You also have an indicator that signifies whether the hospital was privately or publicly run.
(more…)
It’s that time of year: flu season.
Let’s imagine you have been asked to determine the factors that will help a hospital determine the length of stay in the intensive care unit (ICU) once a patient is admitted.
The hospital tells you that once the patient is admitted to the ICU, he or she has a day count of one. As soon as they spend 24 hours plus 1 minute, they have stayed an additional day.
Clearly this is count data. There are no fractions, only whole numbers.
To help us explore this analysis, let’s look at real data from the State of Illinois. We know the patients’ ages, gender, race and type of hospital (state vs. private).
A partial frequency distribution looks like this: (more…)