Proportion and percentage data are tricky to analyze.
Much like count data, they look like they should work in a linear model.
They’re numeric. They’re often continuous.
And sometimes they do work. Some proportion data do look normally distributed so estimates and p-values are reasonable.
But more often they don’t. So estimates and p-values are a mess. Luckily, there are other options. One is beta regression.
Beta Regression
Like logistic and Poisson regression, beta regression is a type of generalized linear model.
It works nicely for proportion data because the values of a variable with a beta distribution must be continuous and fall between 0 and 1.
It’s a bit of a funky distribution in that it’s shape can change a lot depending on the values of the mean and dispersion parameters.
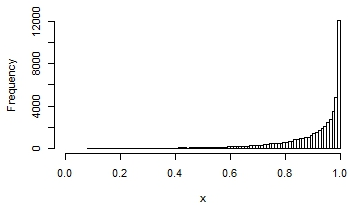
Here are a few examples of the possible shapes of a beta distribution, with different means and variances:
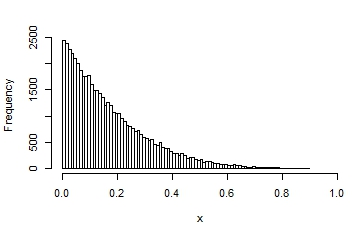
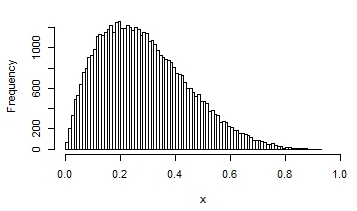
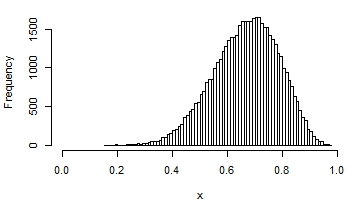
You can see that in some, the distribution looks quite normal. It that situation, you would get reasonable interval estimates and p-values if you assumed normality.
But here is just the kind of sticky situation you commonly see in real data. Let’s say you want to compare the mean proportion of time that people do some behavior–take their prescribed medication, sit, or act physically aggressively toward peers.
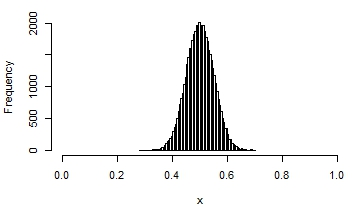
Maybe you’ve got some intervention that you want to test will help people take their medications. Perhaps the control group indeed looks like the nice normal distribution in the third graph above.
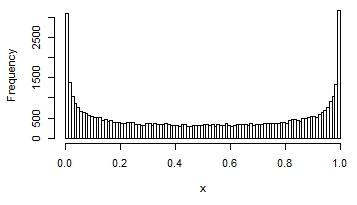
But the treatment worked so well that in the intervention group, the distribution is highly skewed. It looks like the last graph.
Assuming normality isn’t going to work here. That’s where a beta regression can work instead.
One big problem.
0 and 1 aren’t possible values in a beta distribution. So if Y|X follows a beta distribution, Y can have values close to 0 and 1, say .001 or .998. But not 0 or 1 exactly.
So if a client takes their medication 300 out of 300 days, a beta regression won’t run. You can’t have any 0s or 1s in the data set.
Zero-One Inflated Beta Models
There is, however, a version of beta regression model that can work in this situation. It’s one of those models that has been around in theory for a while, but is only in the past few years become available in (some) mainstream statistical software.
It’s called a Zero-One-Inflated Beta and it works very much like a Zero-Inflated Poisson model.
And it’s a type of mixture model that says there are really three processes going on.
One is a process that distinguishes between zeros and non-zeros. The idea is there is something qualitatively different about people who never take their medication than those who do, at least sometimes.
Likewise, there is a process that distinguishes between ones and non-ones. Again, there is something qualitatively different about people who always take their medication than those who do sometimes or never.
And then there is a third process that determines how much someone takes their medication if they do some of the time.
The first and second processes are run through a logistic regression and the third through a beta regression.
These three models run simultaneously. They can each have their own set of predictors and their own set of coefficients. For example, maybe memory is a big predictor of how often someone takes their medication if they take it sometimes, but not at all an issue for whether or not someone takes it 0 times. Perhaps those people aren’t forgetting–they can’t afford to purchase it.
So maybe whether someone has health insurance that pays for the medication is a predictor in the zero/non-zero logistic regression, but not in the other two parts.
Depending on the shape of the distribution, you may not need all three processes. If there are no zeros in the data set, you may only need to accommodate inflation at 1.
It’s highly flexible and adds important options to your data analysis toolbox.

Maarten L. Buis has written a zero-one inflated beta regression package for Stata. For more info, type this command:
ssc describe zoib
It has been suggested that one can deal with the endpoints issue with this adjustment
(depvar * (N − 1) + 0.5)/N
How would this compare?
Hi! Just curious, I have been reading about beta regressions (are those the same as what is discussed here?) and most of the papers say these models are better for continuous proportional data, so count-derived proportions do not work with this kind of approach? I havent’ been able to find a way to analyze one-inflated, count-derived proportional data without transforming it.
Yes, this is a type of beta regression. Proportion data can be either continuous or discrete. Beta is appropriate for continuous proportion data. If the counts are counts out of a certain number of trials, they’re discrete, and that’s usually done with a binomial logistic regression.
Now at some point, when the number of trials becomes large enough, those discrete values look somewhat continuous, and the beta can fit nicely, even if technically the proportions are discrete.
Thanks for the great summary on zero-and-one-inflated beta models. I was wondering how one uses these (hurdle) models for prediction, incorporating both the probabilities of having a 0 or 1 value (from the Poisson components) and the predicted values for (0,1) from the Beta component. many thanks
I would like to know what R packages exist to run Zero-One Inflated Beta Models. Do they estimate parameters via maximum likelihood?
Thank you very much in advance.
Zoib is an R pkg that handles Zero-One.
I use the brms package to estimate Bayesian Zero-One Inflated Beta models. You specify this by adding “family = zero_one_inflated_beta” to your call.
https://cran.r-project.org/web/packages/brms/vignettes/brms_families.html
Thanks Jeff! I am headed to brms now.
Hi Jeff,
Do you know any helpful documents for someone completely unfamiliar with Bayesian and brms? I’ve tried following along with the package documentation and continue to get lost.