Choosing a Statistical Test

Five Common Relationships Among Three Variables in a Statistical Model

February 7th, 2014 by

In a statistical model–any statistical model–there is generally one way that a predictor X and a response Y can relate:Stage 2

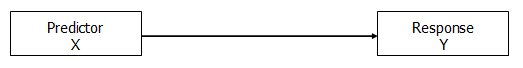
This relationship can take on different forms, of course, like a line or a curve, but there’s really only one relationship here to measure.

Usually the point is to model the predictive ability, the effect, of X on Y.

In other words, there is a clear response variable*, although not necessarily a causal relationship. We could have switched the direction of the arrow to indicate that Y predicts X or used a two-headed arrow to show a correlation, with no direction, but that’s a whole other story.

For our purposes, Y is the response variable and X the predictor.

But a third variable–another predictor–can relate to X and Y in a number of different ways.  How this predictor relates to X and Y changes how we interpret the relationship between X and Y. (more…)


Steps to Running Any Statistical Model Questions, Part 1

February 15th, 2013 by

Recently I gave a webinar The Steps to Running Any Statistical Model.  A few hundred people were live on the webinar.  We held a Q&A session at the end, but as you can imagine, we didn’t have time to get through all the questions.

This is the first in a series of written answers to some of those questions.  I’ve tried to sort them by the step each is about.

A written list of the steps is available here.

If you missed the webinar, you can view the video here.  It’s free.

Questions about Step 1. Write out research questions in theoretical and operational terms

Q: In using secondary data research designing, have you found that this type of data source affects the research question? That is, should one have a strong understanding of the data to ensure their theoretical concept can be operational to fit the data?  My research question changes the more I learn.

Yes.  There’s no point in asking research questions that the data you have available can’t answer.

So the order of the steps would have to change—you may have to start with a vague idea of the type of research question you want to ask, but only refine it after doing some descriptive statistics, or even running an initial model.


Q: How soon in the process should one start with the first group of steps?

You want to at least start thinking about them as you’re doing the lit review and formulating your research questions.

Think about how you could measure variables, which ones are likely to be collinear or have a lot of missing data.  Think about the kind of model you’d have to do for each research question.

Think of a scenario where the same research question could be operationalized such that the dependent variable is measured either continuous or ordered categories.  An easy example is income in dollars measured by actual income or by income categories.

By all means, if people can answer the question with a real and accurate number, your analysis will be much, much easier.  In many situations, they can’t.  They won’t know, remember, or tell you their exact income.  If so, you may have to use categories to prevent missing data.  But these are things to think about early.


Q: where in the process do you use existing lit/results to shape the research question and modeling?

I would start by putting the literature review before Step 1.  You’ll use that to decide on a theoretical research question, as well as ways to operationalize it..

But it will help you other places as well.  For example, it helps the sample size calculations to have variance estimates from other studies.  Other studies may give you an idea of variables that are likely to have missing data, too little variation to include as predictors.  They may change your exploratory factor analysis in Step 7 to a confirmatory one.

In fact, just about every step can benefit from a good literature review.

If you missed the webinar, you can view the video here.  It’s free.


Strategies for Choosing and Planning a Statistical Analysis

November 9th, 2012 by

The first real data set I ever analyzed was from my senior honors thesis as an undergraduate psychology major. I had taken both intro stats and an ANOVA class, and I applied all my new skills with gusto, analyzing every which way.

It wasn’t too many years into graduate school that I realized that these data analyses were a bit haphazard and not at all well thought out. 20 years of data analysis experience later and I realized that’s just a symptom of being an inexperienced data analyst.

But even experienced data analysts can get off track, especially with large data sets with many variables. It’s just so easy to try one thing, then another, and pretty soon you’ve spent weeks getting nowhere. (more…)


When Assumptions of ANCOVA are Irrelevant

October 15th, 2012 by

Every once in a while, I work with a client who is stuck between a particular statistical rock and hard place. It happens when they’re trying to run an analysis of covariance (ANCOVA) model because they have a categorical independent variable and a continuous covariate.

Stage 2

The problem arises when a coauthor, committee member, or reviewer insists that ANCOVA is inappropriate in this situation because one of the following ANCOVA assumptions are not met:

1. The independent variable and the covariate are independent of each other.

2. There is no interaction between independent variable and the covariate.

If you look them up in any design of experiments textbook, which is usually where you’ll find information about ANOVA and ANCOVA, you will indeed find these assumptions.  So the critic has nice references.

However, this is a case where it’s important to stop and think about whether the assumptions apply to your situation, and how dealing with the assumption will affect the analysis and the conclusions you can draw. (more…)


When To Fight For Your Analysis and When To Jump Through Hoops

February 14th, 2012 by

In the world of data analysis, there’s not always one clearly appropriate analysis for every research question.

There are so many issues to take into account.  They include the research question to be answered, the measurement of the variables, the study design, data limitations and issues, the audience, practical constraints like software availability, and the purpose of the data analysis.

So what do you do when a reviewer rejects your choice of data analysis? This reviewer can be your boss, your dissertation committee, a co-author, or journal reviewer or editor.

What do you do?

There are ultimately only two choices: You can redo the analysis their way. Or you can fight for your analysis. How do you choose?

The one absolute in this choice is that you have to honor the integrity of your data analysis and yourself.

Do not be persuaded to do an analysis that will produce inaccurate or misleading results, especially when readers will actually make decisions based on these results. (If no one will ever read your report, this is less crucial).

But even within that absolute, there are often choices. Keep in mind the two goals in data analysis:

  1. The analysis needs to accurately reflect the limits of the design and the data, while still answering the research question.
  2. The analysis needs to communicate the results to the audience.

When to fight for your analysis

So first and foremost, if your reviewer is asking you to do an analysis that does not appropriately take into account the design or the variables, you need to fight.

For example, a few years ago I worked with a researcher who had a study with repeated measurements on the same individuals. It had a small sample size and an unequal number of observations on each individual.

It was clear that to take into account the design and the unbalanced data, the appropriate analysis was a linear mixed model.

The researcher’s co-author questioned the use of the linear mixed model, mainly because he wasn’t familiar with it. He thought the researcher was attempting something fishy. His suggestion was to use an ad hoc technique of averaging over the multiple observations for each subject.

This was a situation where fighting was worth it.

Unnecessarily simplifying the analysis to please people who were unfamiliar with an appropriate method was not an option. The simpler model would have violated assumptions.

This was particularly important because the research was being submitted to a high-level journal.

So it was the researcher’s job to educate not only his coauthor, but the readers, in the form of explaining the analysis and its advantages, with citations, right in the paper.

When to Jump through Hoops

In contrast, sometimes the reviewer is not really asking for a completely different analysis. They just want a different way of running the same analysis or reporting different specific statistics.

For example a simple confirmatory factor analysis can be run in standard statistical software like SAS, SPSS, or Stata using a factor analysis command. Or it can be run it in structural equation modeling software like Amos or MPlus or using an SEM command in standard software.

The analysis is essentially the same, but the two types of software will report different statistics.

If your committee members are familiar with structural equation modeling, they probably want to see the type of statistics that structural equation modeling software will report. Running it this way has advantages.

These include overall model fit statistics like RMSEA or model chi-squares.

This is a situation where it may be easier, and produces no ill-effects, to jump through the hoop.

Running the analysis in the software they prefer won’t violate any assumptions or produce inaccurate results. This assumes you have access to that software and know how to use it.

If the reviewer can stop your research in its tracks, it may be worth it to rerun the analysis to get the statistics they want to see reported.

You do have to decide whether the cost of jumping through the hoop, in terms of time, money, and emotional energy, is worth it.

If the request is relatively minor, it usually is. If it’s a matter of rerunning every analysis you’ve done to indulge a committee member’s pickiness, it may be worth standing up for yourself and your analysis.

When you can’t talk to the reviewer

When you’re dealing with anonymous reviewers, the situation can get sticky.  After all, you cannot ask them to clarify their concerns. And you have limited opportunities to explain the reasons for choosing your analysis.

It may be harder to discern if they are being overly picky, don’t understand the statistics themselves, or have a valid point.

If you choose to stand up for yourself, be well armed. Research the issue until you are absolutely confident in your approach (or until you’re convinced that you were missing something).

A few hours in the library or talking with a trusted expert is never a wasted investment. Compare that to running an unpublishable analysis to please a committee member or coauthor.

Often, the problem is actually not in the analysis you did, but in the way you explained it. It’s your job to explain why the analysis is appropriate and, if it’s unfamiliar to readers, what it does.

Rewrite that section, making it very clear. Ask colleagues to review it. Cite other research that uses or explains that statistical method.

Whatever you choose, be confident that you made the right decision, then move on.


What Makes a Statistical Analysis Wrong?

January 21st, 2010 by

One of the most anxiety-laden questions I get from researchers is whether their analysis is “right.”

I’m always slightly uncomfortable with that word. Often there is no one right analysis.

It’s like finding Mr. or Ms. Right. Most of the time, there is not just one Right. But there are many that are clearly Wrong.

What Makes an Analysis Right?

Luckily, what makes an analysis right is easier to define than what makes a person right for you. It pretty much comes down to two things: whether the assumptions of the statistical method are being met and whether the analysis answers the research question.

Assumptions are very important. A test needs to reflect the measurement scale of the variables, the study design, and issues in the data. A repeated measures study design requires a repeated measures analysis. A binary dependent variable requires a categorical analysis method.

But within those general categories, there are often many analyses that meet assumptions. A logistic regression or a chi-square test both handle a binary dependent variable with a single categorical predictor. But a logistic regression can answer more research questions. It can incorporate covariates, directly test interactions, and calculate predicted probabilities. A chi-square test can do none of these.

So you get different information from different tests. They answer different research questions.

An analysis that is correct from an assumptions point of view is useless if it doesn’t answer the research question. A data set can spawn an endless number of statistical tests that don’t answer the research question. And you can spend an endless number of days running them.

When to Think about the Analysis

The real bummer is it’s not always clear that the analyses aren’t relevant until you  write up the research paper.

That’s why writing out the research questions in theoretical and operational terms is the first step of any statistical analysis. It’s absolutely fundamental. And I mean writing them in minute detail. Issues of mediation, interaction, subsetting, control variables, et cetera, should all be blatantly obvious in the research questions.

Thinking about how to analyze the data before collecting the data can help you from hitting a dead end. It can be very obvious, once you think through the details, that the analysis available to you based on the data won’t answer the research question.

Whether the answer is what you expected or not is a different issue.

So when you are concerned about getting an analysis “right,” clearly define the design, variables, and data issues, but most importantly, get explicitly clear about what you want to learn from this analysis.

Once you’ve done this, it’s much easier to find the statistical method that answers the research questions and meets assumptions. Even if you don’t know the right method, you can narrow your search with clear guidance.