 Level is a statistical term that is confusing because it has multiple meanings in different contexts (much like alpha and beta).
There are three different uses of the term Level in statistics that mean completely different things. What makes this especially confusing is that all three of them can be used in the exact same analysis context.
I’ll show you an example of that at the end.
So when you’re talking to someone who is learning statistics or who happens to be thinking of that term in a different context, this gets especially confusing.
Levels of Measurement
 The most widespread of these is levels of measurement. Stanley Stevens came up with this taxonomy of assigning numerals to variables in the 1940s. You probably learned about them in your Intro Stats course: the nominal, ordinal, interval, and ratio levels.
Levels of measurement is really a measurement concept, not a statistical one. It refers to how much and the type of information a variable contains. Does it indicate an unordered category, a quantity with a zero point, etc?
So if you hear the following phrases, you’ll know that we’re using the term level to mean measurement level:
- nominal level
- ordinal level
- interval level
- ratio level
It is important in statistics because it has a big impact on which statistics are appropriate for any given variable. For example, you would not do the same test of association between two variables measured at a nominal level as you would between two variables measured at an interval level.
That said, levels of measurement aren’t the only information you need about a variable’s measurement. There is, of course, a lot more nuance.
Levels of a Factor
Another common usage of the term level is within experimental design and analysis. And this is for the levels of a factor. Although Factor itself has multiple meanings in statistics, here we are talking about a categorical independent variable.
In experimental design, the predictor variables (also often called Independent Variables) are generally categorical and nominal. They represent different experimental conditions, like treatment and control conditions.
Each of these categorical conditions is called a level.
Here are a few examples:
- In an agricultural study, a fertilizer treatment variable has three levels: Organic fertilizer (composted manure); High concentration of chemical fertilizer; low concentration of chemical fertilizer.So you’ll hear things like: “we compared the high concentration level to the control level.”
- In a medical study, a drug treatment has three levels: Placebo; standard drug for this disease; new drug for this disease.
- In a linguistics study, a word frequency variable has two levels: high frequency words; low frequency words.
Now, you may have noticed that some of these examples actually indicate a high or low level of something. I’m pretty sure that’s where this word usage came from. But you’ll see it used for all sorts of variables, even when they’re not high or low.
Although this use of level is very widespread, I try to avoid it personally. Instead I use the word “value” or “category” both of which are accurate, but without other meanings. That said, “level” is pretty entrenched in this context.
Level in Multilevel Models or Multilevel Data
A completely different use of the term is in the context of multilevel models. Multilevel models is a 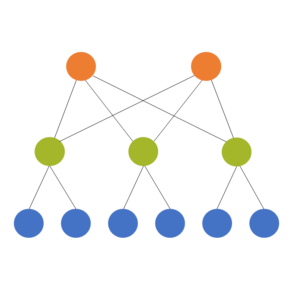 term for some mixed models. (The terms multilevel models and mixed models are often used interchangably, though mixed model is a bit more flexible).
Multilevel models are used for multilevel (also called hierarchical or nested) data, which is where they get their name. The idea is that the units we’ve sampled from the population aren’t independent of each other. They’re clustered in such a way that their responses will be more similar to each other within a cluster.
The models themselves have two or more sources of random variation. A two level model has two sources of random variation and can have predictors at each level.
A common example is a model from a design where the response variable of interest is measured on students. It’s hard though, to sample students directly or to randomly assign them to treatments, since there is a natural clustering of students within schools.
So the resource-efficient way to do this research is to sample students within schools.
Predictors can be measured at the student level (eg. gender, SES, age) or the school level (enrollment, % who go on to college). The dependent variable has variation from student to student (level 1) and from school to school (level 2).
We always count these levels from the bottom up. So if we have students clustered within classroom and classroom clustered within school and school clustered within district, we have:
- Level 1: Students
- Level 2: Classroom
- Level 3: School
- Level 4: District
So this use of the term level describes the design of the study, not the measurement of the variables or the categories of the factors.
Putting them together
So this is the truly unfortunate part. There are situations where all three definitions of level are relevant within the same statistical analysis context.
I find this unfortunate because I think using the same word to mean completely different things just confuses people. But here it is:
Picture that study in which students are clustered within school (a two-level design). Each school is assigned to use one of three math curricula (the independent variable, which happens to be categorical).
So, the variable “math curriculum” is a factor with three levels (ie, three categories).
Because those three categories of “math curriculum” are unordered, “math curriculum” has a nominal level of measurement.
And since “math curriculum” is assigned to each school, it is considered a level 2 variable in the two-level model.
See the rest of the Confusing Statistical Terms series.
First published December 12, 2008
Last Updated January 21, 2025
 One of the important issues with missing data is the missing data mechanism. You may have heard of these: Missing Completely at Random (MCAR), Missing at Random (MAR), and Missing Not at Random (MNAR).
The mechanism is important because it affects how much the missing data bias your results. This has a big impact on what is a reasonable approach to dealing with the missing data. So you have to take it into account in choosing an approach.
The concepts of these mechanisms can be a bit abstract.
And to top it off, two of these mechanisms have really confusing names: Missing Completely at Random and Missing at Random.
Missing Completely at Random (MCAR)
Missing Completely at Random is pretty straightforward. What it means is what is (more…)
The field of statistics has a terminology problem.
It affects students’ ability to learn statistics. It affects researchers’ ability to communicate with statisticians; with collaborators in different fields; and of course, with the general public.
It’s easy to think the real issue is that statistical concepts are difficult. That is true. It’s not the whole truth, though. (more…)
Much like General Linear Model and Generalized Linear Model in #7, there are many examples in statistics of terms with (ridiculously) similar names, but nuanced meanings.
Today I talk about the difference between multivariate and multiple, as they relate to regression.
Multiple Regression
A regression analysis with one dependent variable and eight independent variables is NOT a multivariate regression model. It’s a multiple regression model.
And believe it or not, it’s considered a univariate model.
This is uniquely important to remember if you’re an SPSS user. Choose Univariate GLM (General Linear Model) for this model, not multivariate.
I know this sounds crazy and misleading because why would a model that contains nine variables (eight Xs and one Y) be considered a univariate model?
It’s because of the fundamental idea in regression that Xs and Ys aren’t the same. We’re using the Xs to understand the mean and variance of Y. This is why the residuals in a linear regression are differences between predicted and actual values of Y. Not X.
(And of course, there is an exception, called Type II or Major Axis linear regression, where X and Y are not distinct. But in most regression models, Y has a different role than X).
It’s the number of Ys that tell you whether it’s a univariate or multivariate model. That said, other than SPSS, I haven’t seen anyone use the term univariate to refer to this model in practice. Instead, the assumed default is that indeed, regression models have one Y, so let’s focus on how many Xs the model has. This leads us to…
Simple Regression: A regression model with one Y (dependent variable) and one X (independent variable).
Multiple Regression: A regression model with one Y (dependent variable) and more than one X (independent variables).
References below.
Multivariate Regression
Multivariate analysis ALWAYS describes a situation with multiple dependent variables.
So a multivariate regression model is one with multiple Y variables. It may have one or more than one X variables. It is equivalent to a MANOVA: Multivariate Analysis of Variance.
Other examples of Multivariate Analysis include:
- Principal Component Analysis
- Factor Analysis
- Canonical Correlation Analysis
- Linear Discriminant Analysis
- Cluster Analysis
But wait. Multivariate analyses like cluster analysis and factor analysis have no dependent variable, per se. Why is it about dependent variables?
Well, it’s not really about dependency. It’s about which variables’ mean and variance is being analyzed. In a multivariate regression, we have multiple dependent variables, whose joint mean is being predicted by the one or more Xs. It’s the variance and covariance in the set of Ys that we’re modeling (and estimating in the Variance-Covariance matrix).
Note: this is actually a situation where the subtle differences in what we call that Y variable can help. Calling it the outcome or response variable, rather than dependent, is more applicable to something like factor analysis.
So when to choose multivariate GLM? When you’re jointly modeling the variation in multiple response variables.
References
In response to many requests in the comments, I suggest the following references. I give the caveat, though, that neither reference compares the two terms directly. They simply define each one. So rather than just list references, I’m going to explain them a little.
- Neter, Kutner, Nachtsheim, Wasserman’s Applied Linear Regression Models, 3rd ed. There are, incidentally, newer editions with slight changes in authorship. But I’m citing the one on my shelf.
Chapter 1, Linear Regression with One Independent Variable, includes:
“Regression model 1.1 … is “simple” in that there is only one predictor variable.”
Chapter 6 is titled Multiple Regression – I, and section 6.1 is “Multiple Regression Models: Need for Several Predictor Variables.” Interestingly enough, there is no direct quotable definition of the term “multiple regression.” Even so, it’s pretty clear. Go read the chapter to see.
There is no mention of the term “Multivariate Regression” in this book.
2. Johnson & Wichern’s Applied Multivariate Statistical Analysis, 3rd ed.
Chapter 7, Multivariate Linear Regression Models, section 7.1 Introduction. Here it says:
“In this chapter we first discuss the multiple regression model for the prediction of a single response. This model is then generalized to handle the prediction of several dependent variables.” (Emphasis theirs).
They finally get to Multivariate Multiple Regression in Section 7.7. Here they “consider the problem of modeling the relationship between m responses, Y1, Y2, …,Ym, and a single set of predictor variables.”
Misuses of the Terms
I’d be shocked, however, if there aren’t some books or articles out there where the terms are not used or defined the way I’ve described them here, according to these references. It’s very easy to confuse these terms, even for those of us who should know better.
And honestly, it’s not that hard to just describe the model instead of naming it. “Regression model with four predictors and one outcome” doesn’t take a lot more words and is much less confusing.
If you’re ever confused about the type of model someone is describing to you, just ask.
Read More Explanations of Confusing Statistical Terms.
First Published 4/29/09;
Updated 2/23/21 to give more detail.
 The most widespread of these is levels of measurement. Stanley Stevens came up with this taxonomy of assigning numerals to variables in the 1940s. You probably learned about them in your Intro Stats course: the nominal, ordinal, interval, and ratio levels.
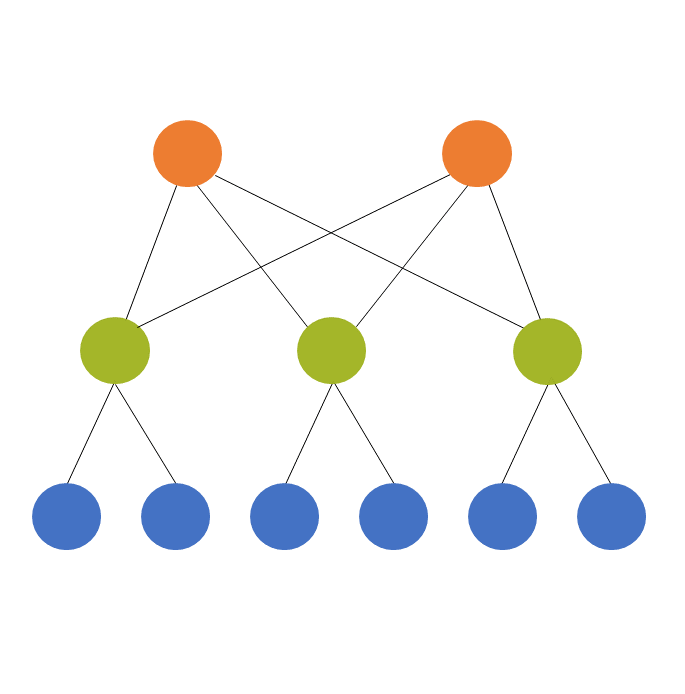 term for some mixed models. (The terms multilevel models and mixed models are often used interchangably, though mixed model is a bit more flexible).