Some repeated measures designs make it quite challenging to specify within-subjects factors. Especially difficult is when the design contains two “levels” of repeat, but your interest is in testing just one.
Let’s look at a great example of what this looks like and how to deal with it in this question from a reader :
The Design:
I want to do a GLM (repeated measures ANOVA) with the valence of some actions of my test-subjects (valence = desirability of actions) as a within-subject factor. My subjects have to rate a number of actions/behaviours in a pre-set list of 20 actions from ‘very likely to do’ to ‘will never do this’ on a scale from 1 to 7, and some of these actions are desirable (e.g. help a blind man crossing the street) and therefore have a positive valence (in psychology) and some others are non-desirable (e.g. play loud music at night) and therefore have negative valence in psychology.
My question is how I can use valence as a within-subjects factor in GLM. Is there a way to tell SPSS some actions have positive valence and others have negative valence ? I assume assigning labels to the actions will not do it, as SPSS does not make analyses based on labels …
Please help. Thank you.
(more…)
Spoiler alert, real data are seldom normally distributed. How does the population distribution influence the estimate of the population mean and its confidence interval?
To figure this out, we randomly draw 100 observations 100 times from three distinct populations and plot the mean and corresponding 95% confidence interval of each sample.
(more…)
 Is it really ok to treat Likert items as continuous?
 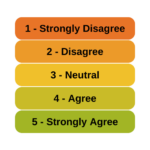 And can you just decide to combine Likert items to make a scale? Likert-type data is extremely common—and so are questions like these about how to analyze it appropriately. (more…)
When is it important to use adjusted R-squared instead of R-squared?
R², the Coefficient of Determination, is one of the most useful and intuitive statistics we have in linear regression.
It tells you how well the model predicts the outcome and has some nice properties. But it also has one big drawback.
(more…)
 A multiple regression model could be conceptualized using Structural Equation Model path diagrams. That’s the simplest SEM you can create, but its real power lies in expanding on that regression model. Here I will discuss four types of structural equation models.
Path Analysis
More interesting research questions could be asked and answered using Path Analysis. Path Analysis is a type of structural equation modeling without latent variables. (more…)
In most regression models, there is one response variable and one or more predictors. From the model’s point of view, it doesn’t matter if those predictors are there to predict, to moderate, to explain, or to control. All that matters is that they’re all Xs, on the right side of the equation.
(more…)